Incidents
"...we're not in Kansas anymore.
-The Wizard of Oz
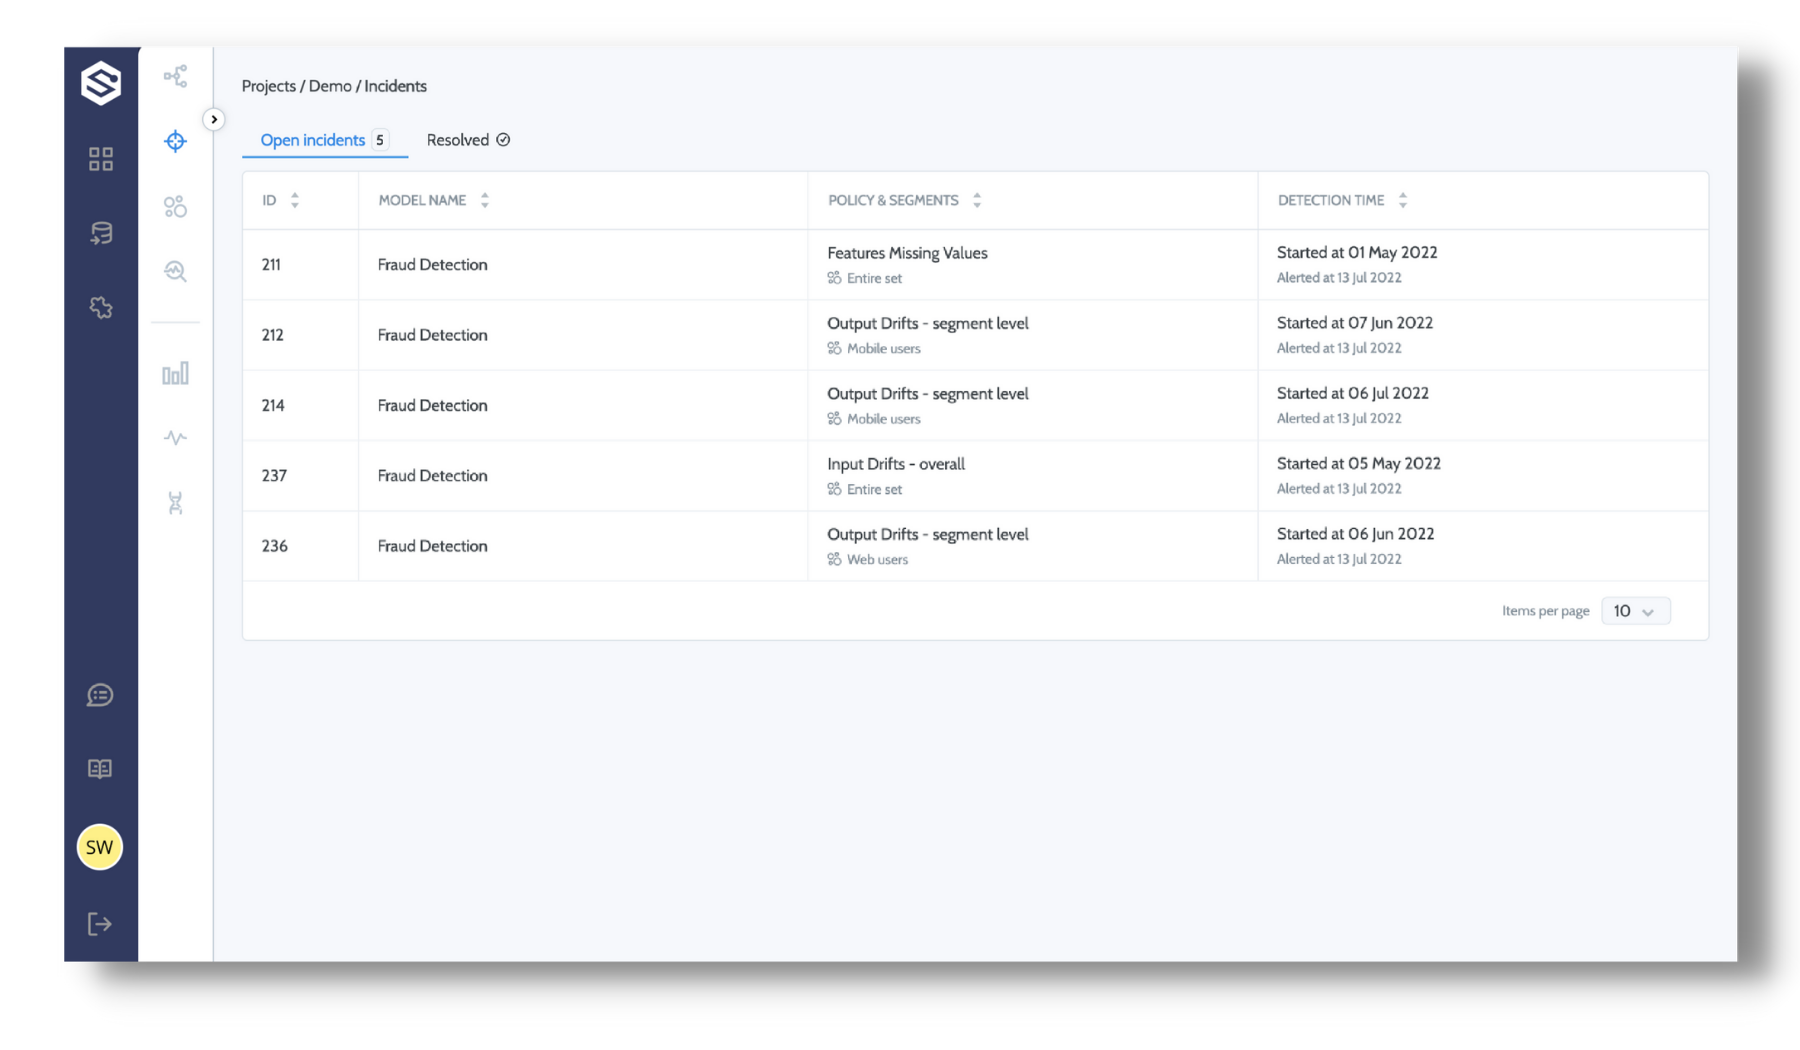
Once you have a monitoring policy in place, Superwise will scan and search for potential violations across the different segments that were defined to scan. Once detected, an incident will be created.
To reduce noise, and provide the user with the full context of an issue, incidents aggregate all relevant policy violations that took place in the same timeframe on the same segment. As long as the policy has open violation based on its conditions, the incident will remain open.
incident
At first glance, you can see general information about the incident:
- ID
- Model - what model the incident is associated with
- Policy & segment - the defined policy & segments on which the anomaly was found
- Detection date - when the incident began and alerted.
Tabs
Open incidents
Open incidents are incidents that are currently occurring. Once an incident is revealed by one of your policies - it will appear in this tab. Near the Open incidents tab, appears a number that states the amount of open incidents.
resolved
Any incident whose monitored metrics were back to normal will automatically move under this tab. There you can see historical anomalies.

incident view
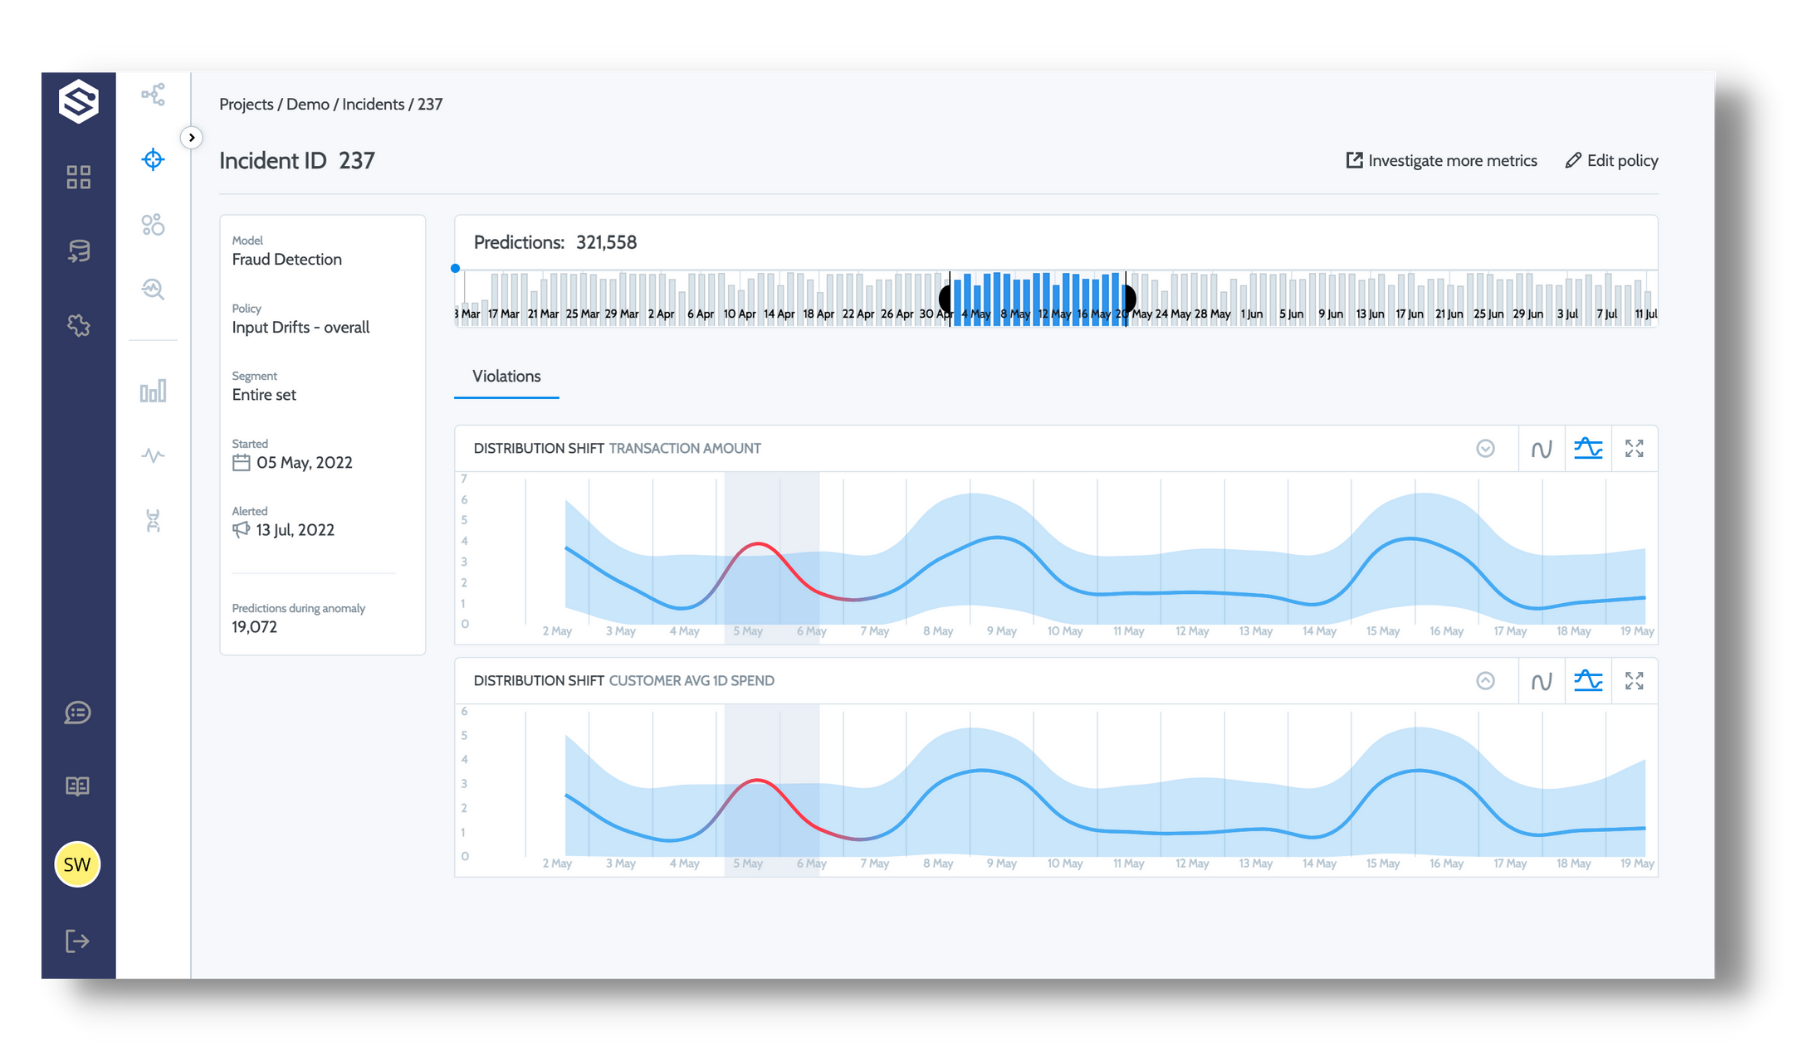
When hovering an incident, the View button will appear on the right side of the screen, clicking on it will lead you to the incident view where you can find all the information about the incident, including drill-down to each of the incident’s anomalies and additional investigation capabilities.
What can you see in the incident view?
- Violations: A combination of a metric and an entity in which an anomaly occurred over a period of time, based on the policy configuration and control limits. You can investigate each of the violations using the following tools:
- Investigate more metrics - a link leading to the metrics page to further investigate in depth the cause of
the anomaly - See distribution or compare distribution to different timeframes or reference dataset
- Analyze different time frames using the predictions chart
- Investigate more metrics - a link leading to the metrics page to further investigate in depth the cause of
- Different time frames: use the predictions graph to change the timeframe of the violation graph.
- General information about the incident:
- Model - what model the incident is associated with
- Policy - defined policy on which the anomaly was found
- Segment - defined segment on which the anomaly was found
- Started - the time the incident began (detected)
- Alerted - the time that Superwise alerted on the anomaly
- Edit policy: If an anomaly is found due to a miss configuration (e.g., too sensitive), you can return to the policy and edit it. You can edit the following:
- Segment - change the population the policy is associated with. For example, you don't want to be
alerted on small segments (to reduce noise) - Scheduling - change the time that Superwise checks the policy.
- Monitoring delay - if the policy runs before you can provide the data to a specific date. We
recommend you update the monitoring delay to suit your pipeline.
- Monitoring delay - if the policy runs before you can provide the data to a specific date. We
- Notifications - change notification channel.
- Minimal incident length - Superwise allows you to configure how many days in a row an anomaly should
accrue to be considered an incident. Increasing it will reduce the sensitivity of your incident
- Segment - change the population the policy is associated with. For example, you don't want to be

investigation capabilities
See entity’s distribution
In order to investigate an anomaly, one of the first things you want to know is how the entity’s distribution looks like - you can either click on the red part of the graph (within the anomaly dates) or simply drag and drop on the dates you wish to see distribution for. This will open a menu with 3 options - simply click on See distribution. A distribution graph will appear in a dedicated pop-up.
Compare distribution to dataset/different timeframe
Context is crucial when it comes to investigation of anomalies. We recommend viewing the distribution of an entity either:
- between 2 timeframes - comparing the distribution within the anomalies dates, against a timeframe that was defined as normal (before the anomaly started. You can either click on the red part of the graph (within the anomaly dates) or simply drag and drop on the anomaly dates and click on
Compare to different timeframe- 2 boxes will appear on the graph - simply move the boxes to cover both timeframes you wish to compare and then click on the blueComparebutton that appears on the graph’s header. - Against a dataset - comparing the distribution within the anomalies dates, against a reference dataset the you count as normal. You can either click on the red part of the graph (within the anomaly dates) or simply drag and drop on the anomaly dates and click on
Compare to reference dataset.
Investigate more metrics
With a click of a button - you are able to export all the metrics within the anomaly into the metrics screen - this will allow you to add additional metrics to the screen in order to get a better overview of how different entities behave during the anomaly dates.
This can be done using the Investigate more metrics button that appears in the top right side of the screen
Updated over 2 years ago
