New Relic
Superwise’s model metrics and incidents integration streamline results of our out-of-the-box model metrics, including drift, activity, incidents, and any custom metrics you configure, directly into New Relic One. You’ll get an immediate overview of which models are misbehaving that can be tailored to any use case, logic, segmentation, threshold, and sensitivity.
How it works
Once a user configures the New Relic integration in Superwise, standard model metrics are sent to New Relic and users get model observability dashboards within New Relic. Users can also configure any specific model metric and incident policy and send them to New Relic for model observability tailored to their business context.
To set up the integration follow these steps:
[1 - Generate New Relic API tokens.] (#Step1)
[2 - Create New Relic integration channel.] (#Step2)
[3 - Explore, monitor, and detect issues in your ML observability dashboard within New Relic.] (#Step3)
This dashboard is generated automatically for standard metrics like drift, activity, and active models.
(Optionally, but definitely recommended)
[4 - Configure custom model metrics and incidents you would like Superwise to send to New Relic.] (#Step4)
You’ll always get our standard model metrics and dashboard but you can build on that with logic, segments, and thresholds to tailor Superwise model observability to your use cases.
The following guide will take you step by step, through integrating and customizing the New Relic integration.
1. Create New Relic API tokens
In your New Relic account, go to account settings and choose “Add more data”.
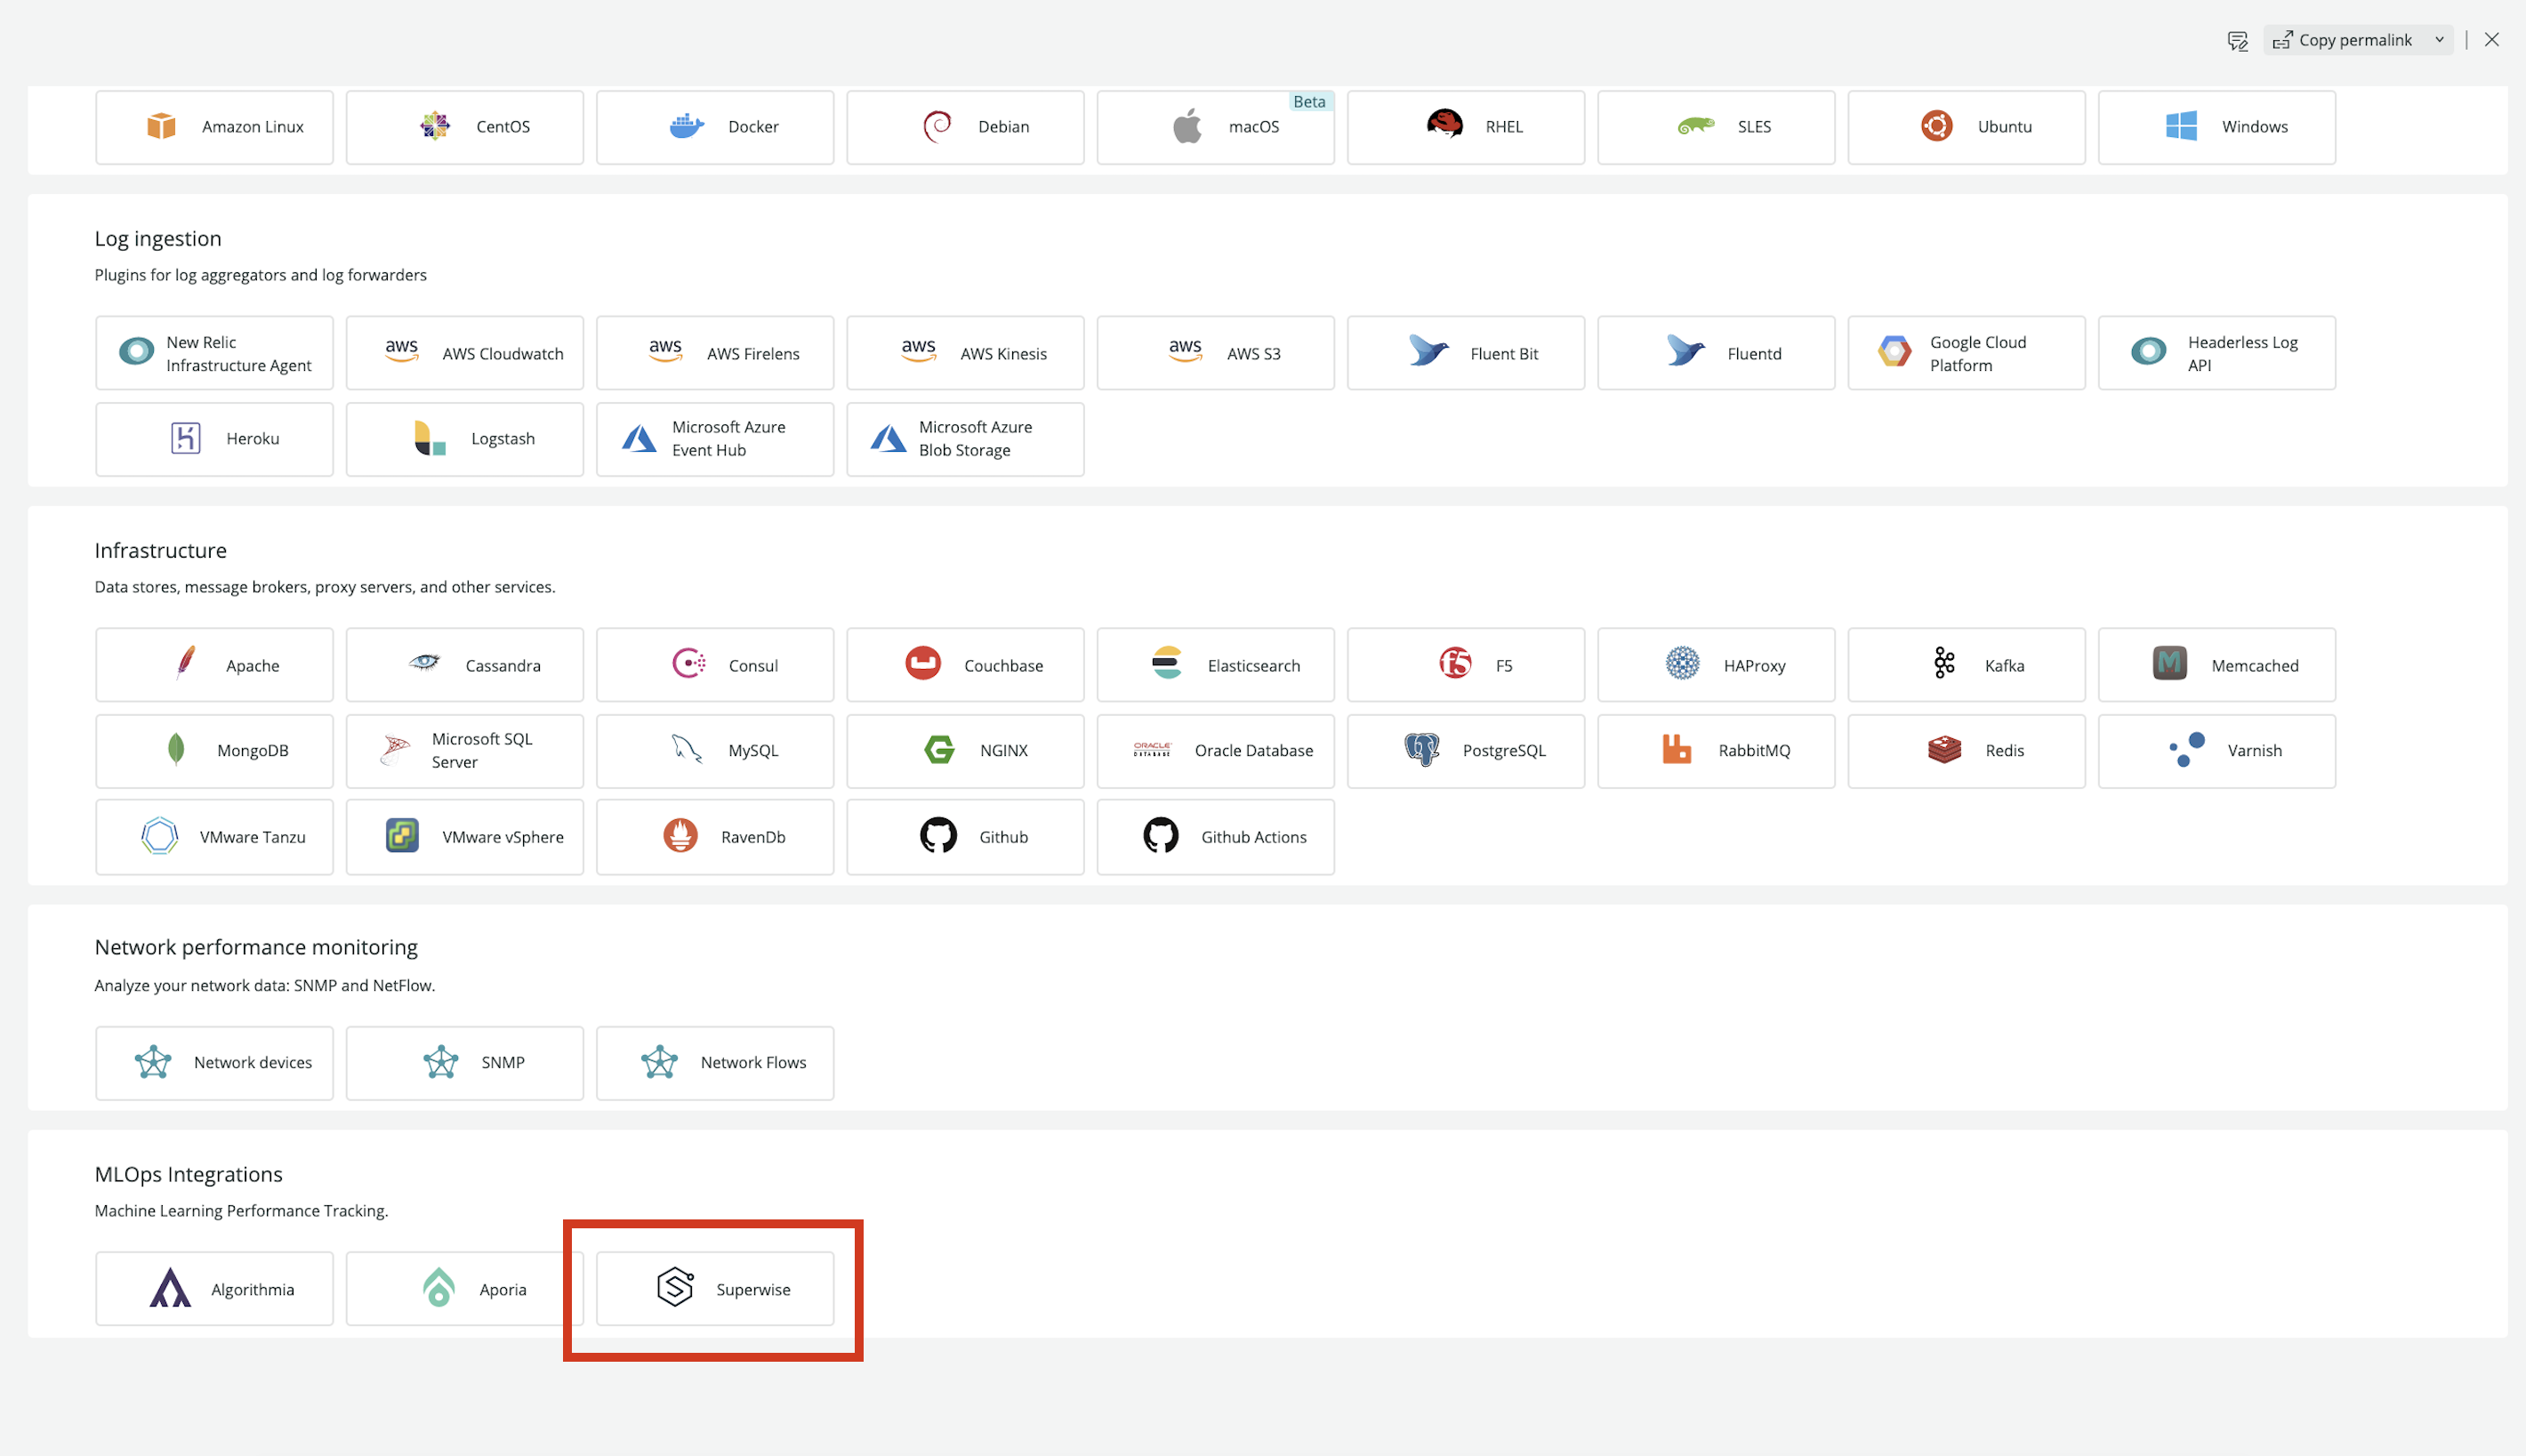
Select Superwise from the available MLOps integrations.
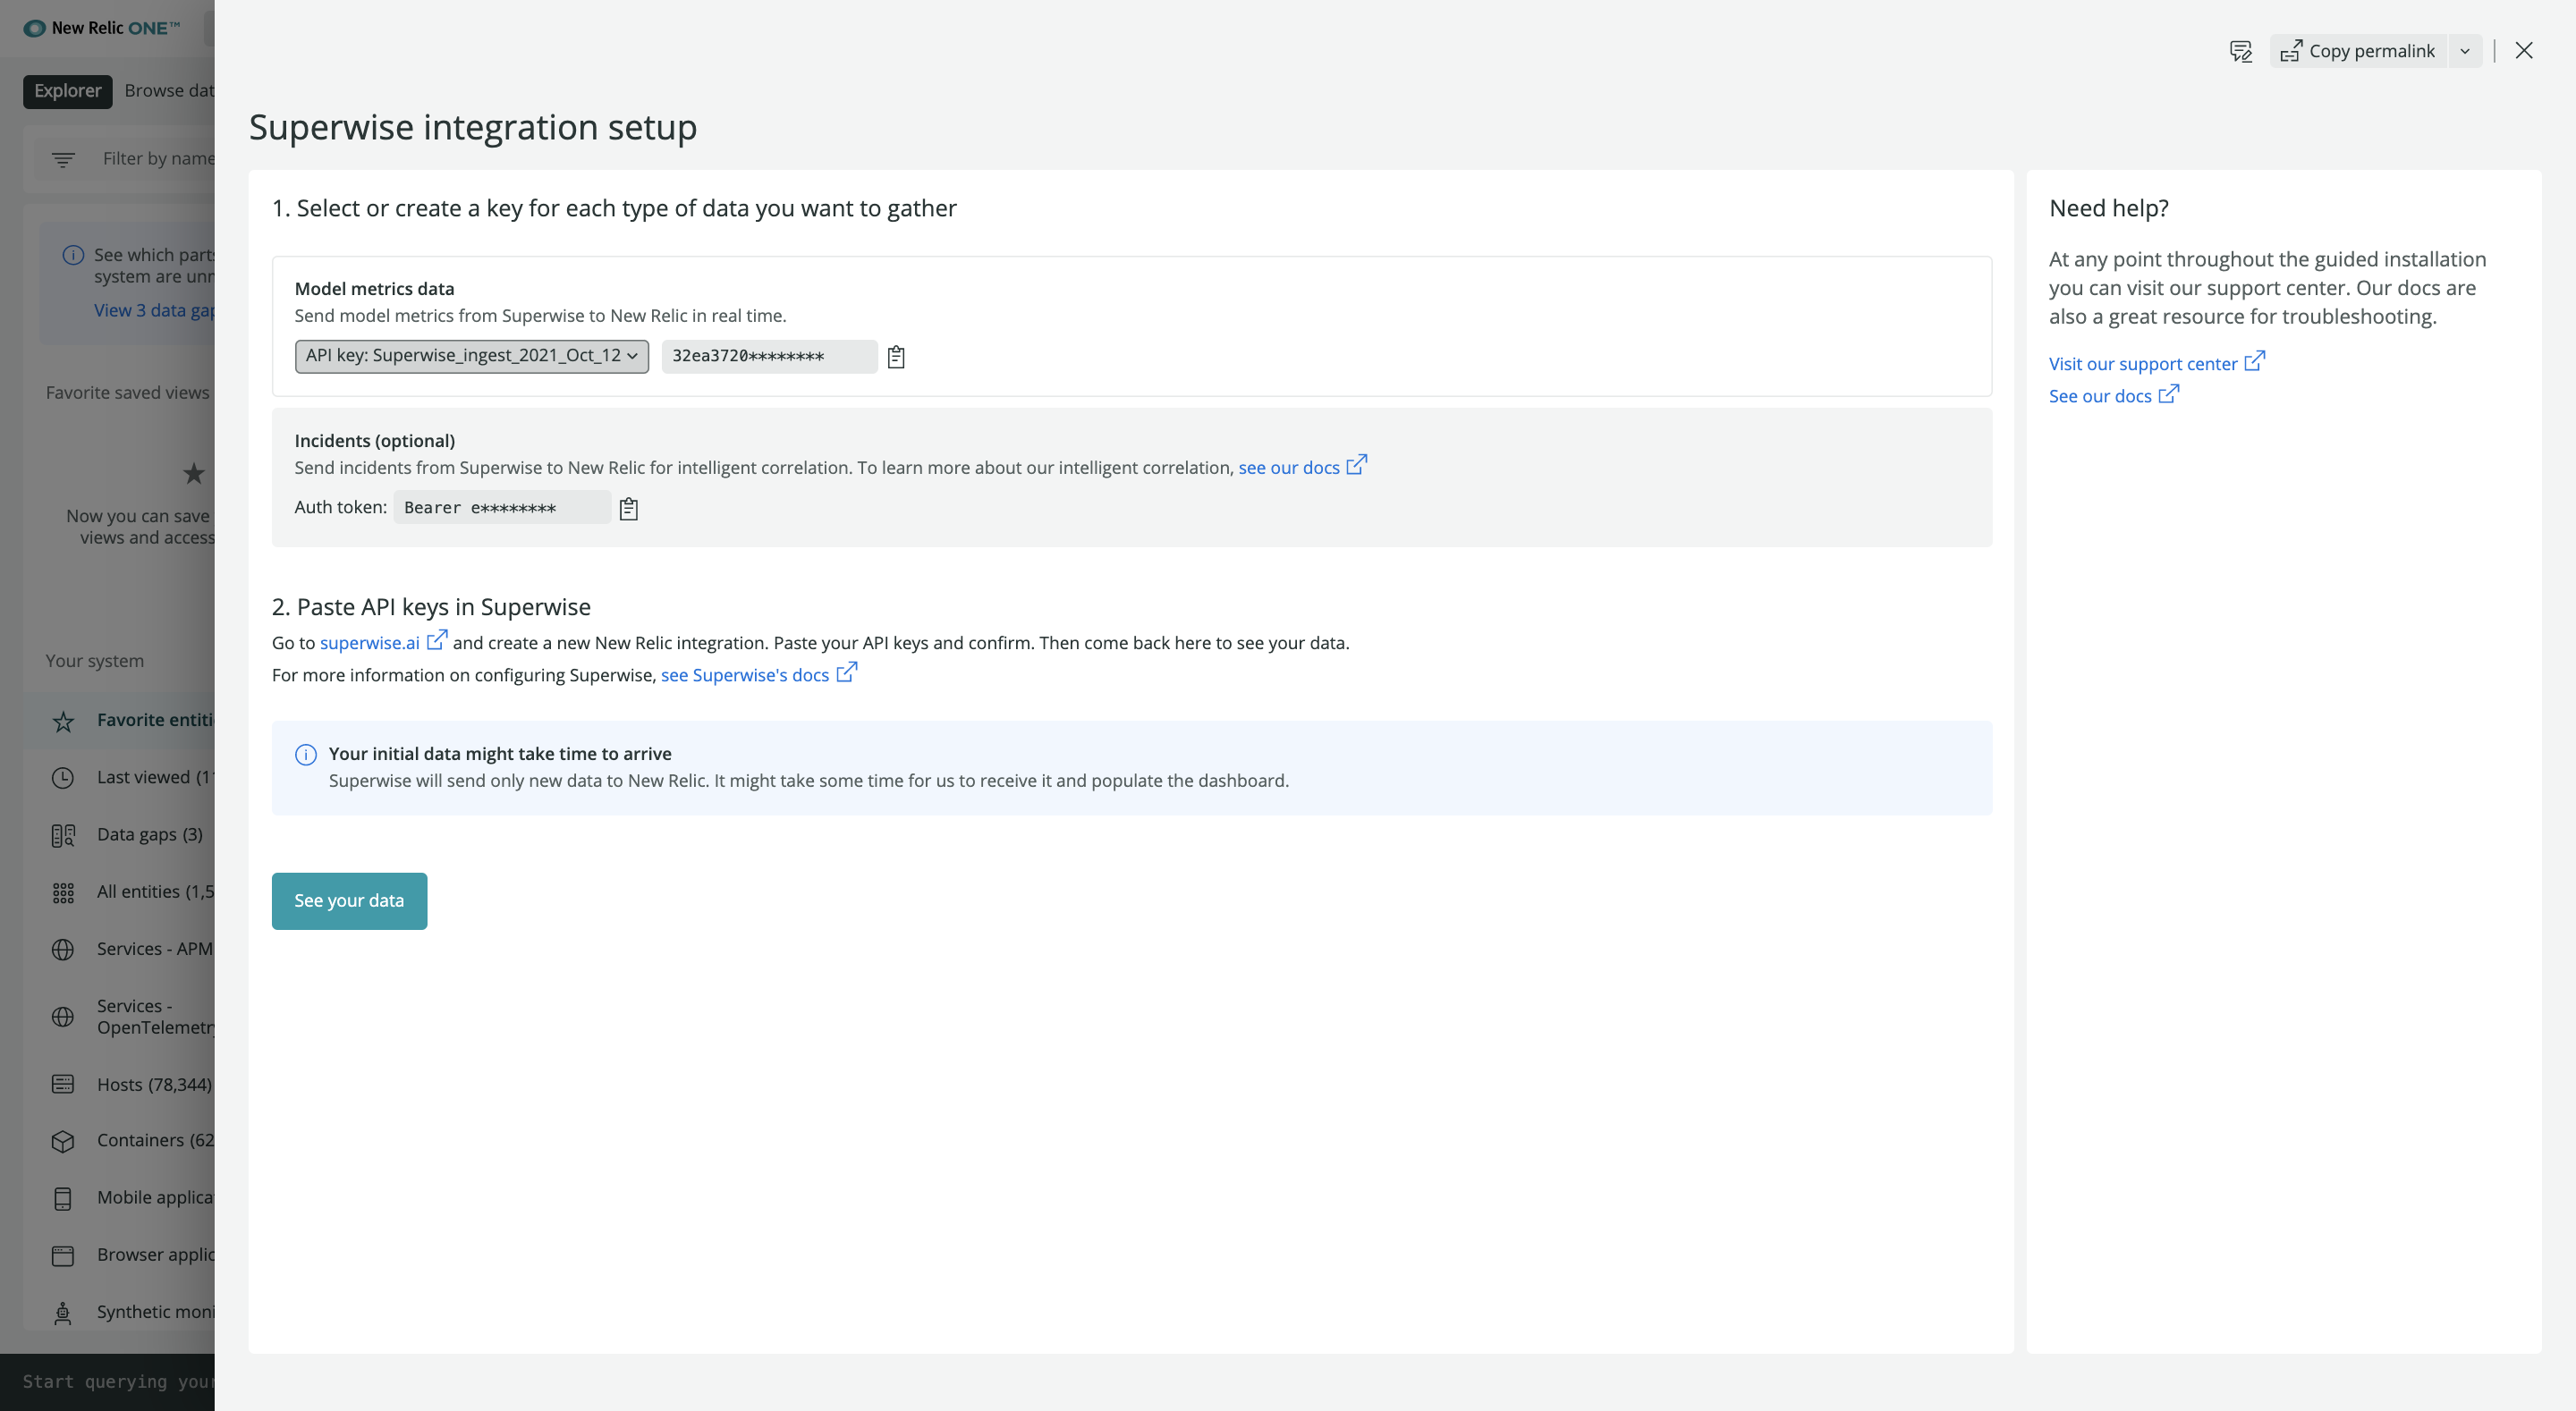
Select the account id you want Superwise to integrate with.
Create two access tokens to your New Relic account, one Model metrics API key, and one Incident key.
Great! You are halfway there. In the following step, you will configure the New Relic tokens you generated in your Superwise account.
Don't close the New Relic window yet
Keep the New Relic screen open as you’ll need it for the next steps where you’ll configure these tokens on the Superwise side to finish the integration.
2. Configure New Relic integration
New Relic can be selected as a notification channel and sent data and incidents to.
Configure a New Relic channel:
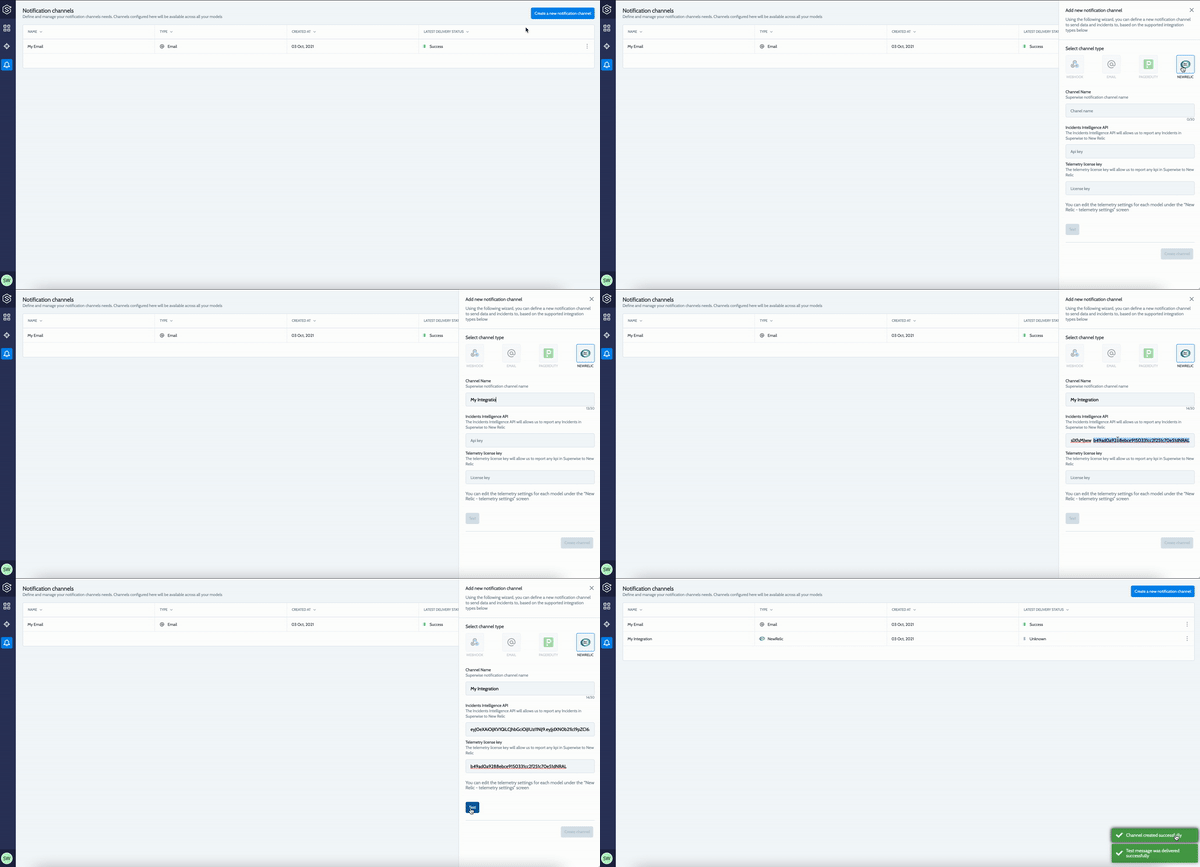
- Go to Notification channel settings.
- Select New Relic, enter a channel name and input the two New Relic tokens you just created during the previous step in New Relic.
- Click on the Test button. The Test button will send a dummy request to your New Relic account to validate the integration. You should get a success message both in Superwise and in your New Relic account. To finish the setup click “Create channel”.
That’s it :)
3. View and explore your Superwise model observability dashboard
Go back to the New Relic integration wizard and press “Continue”. This will take you automatically to your new New Relic dashboard powered by Superwise.
Using your Superwise model observability dashboard:
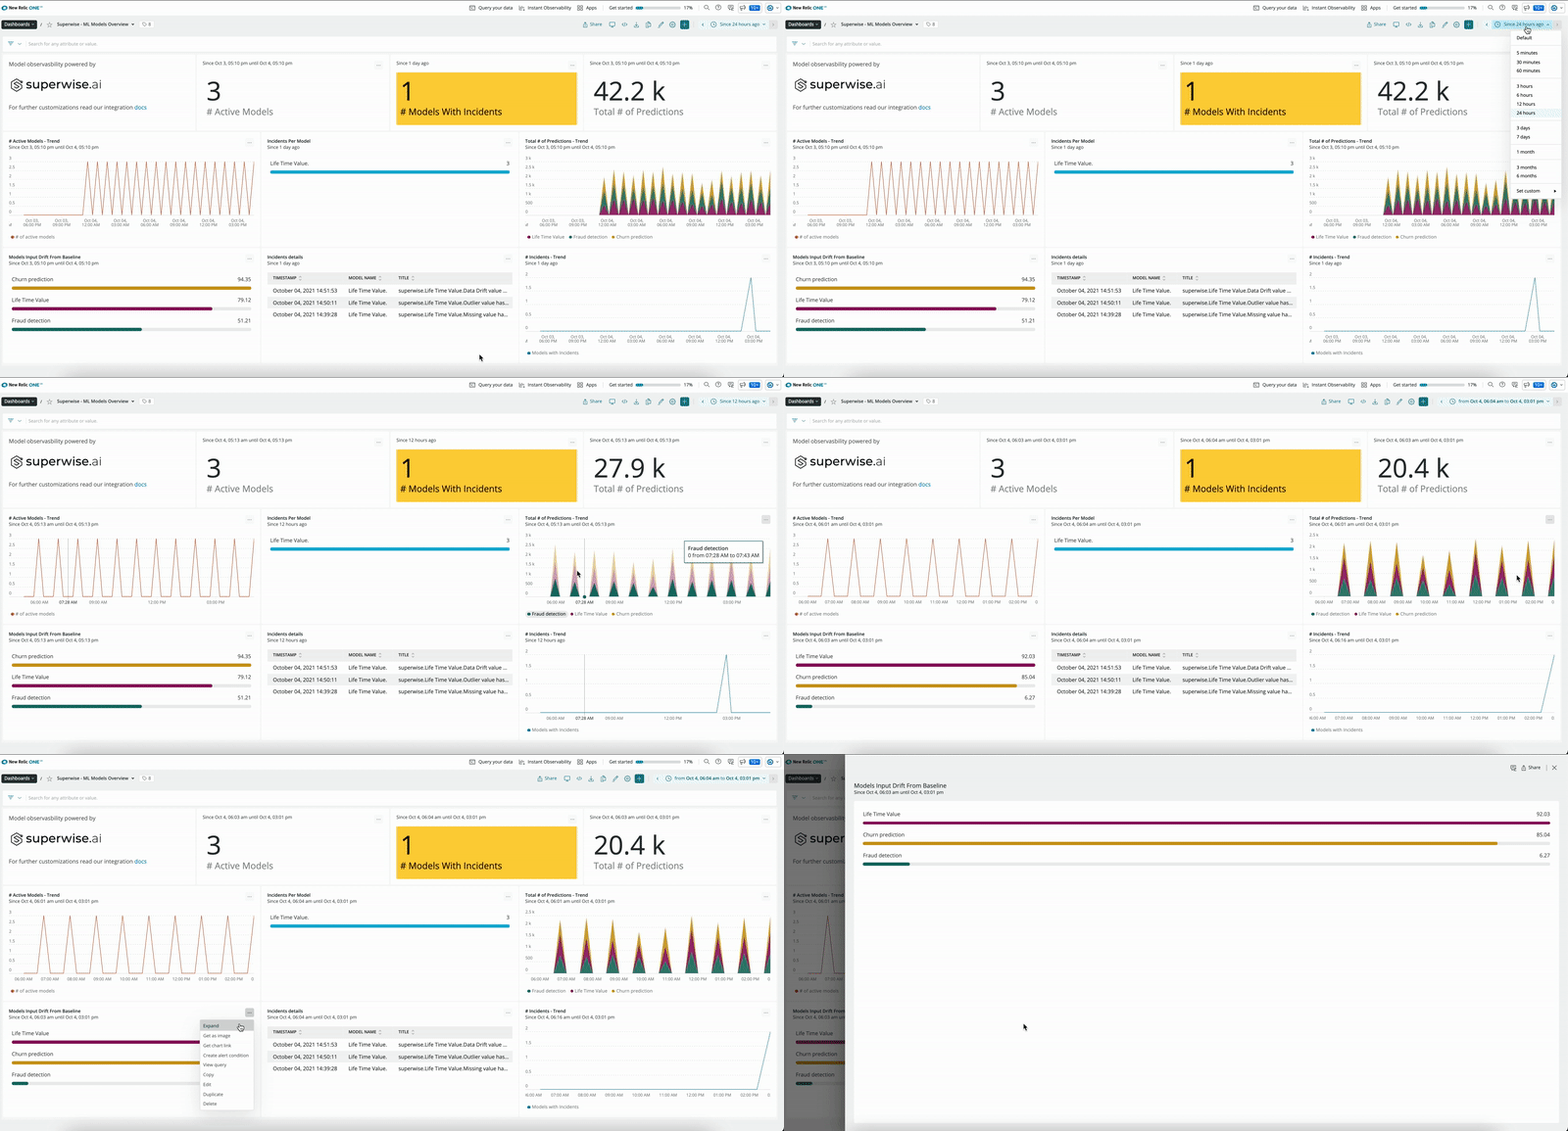
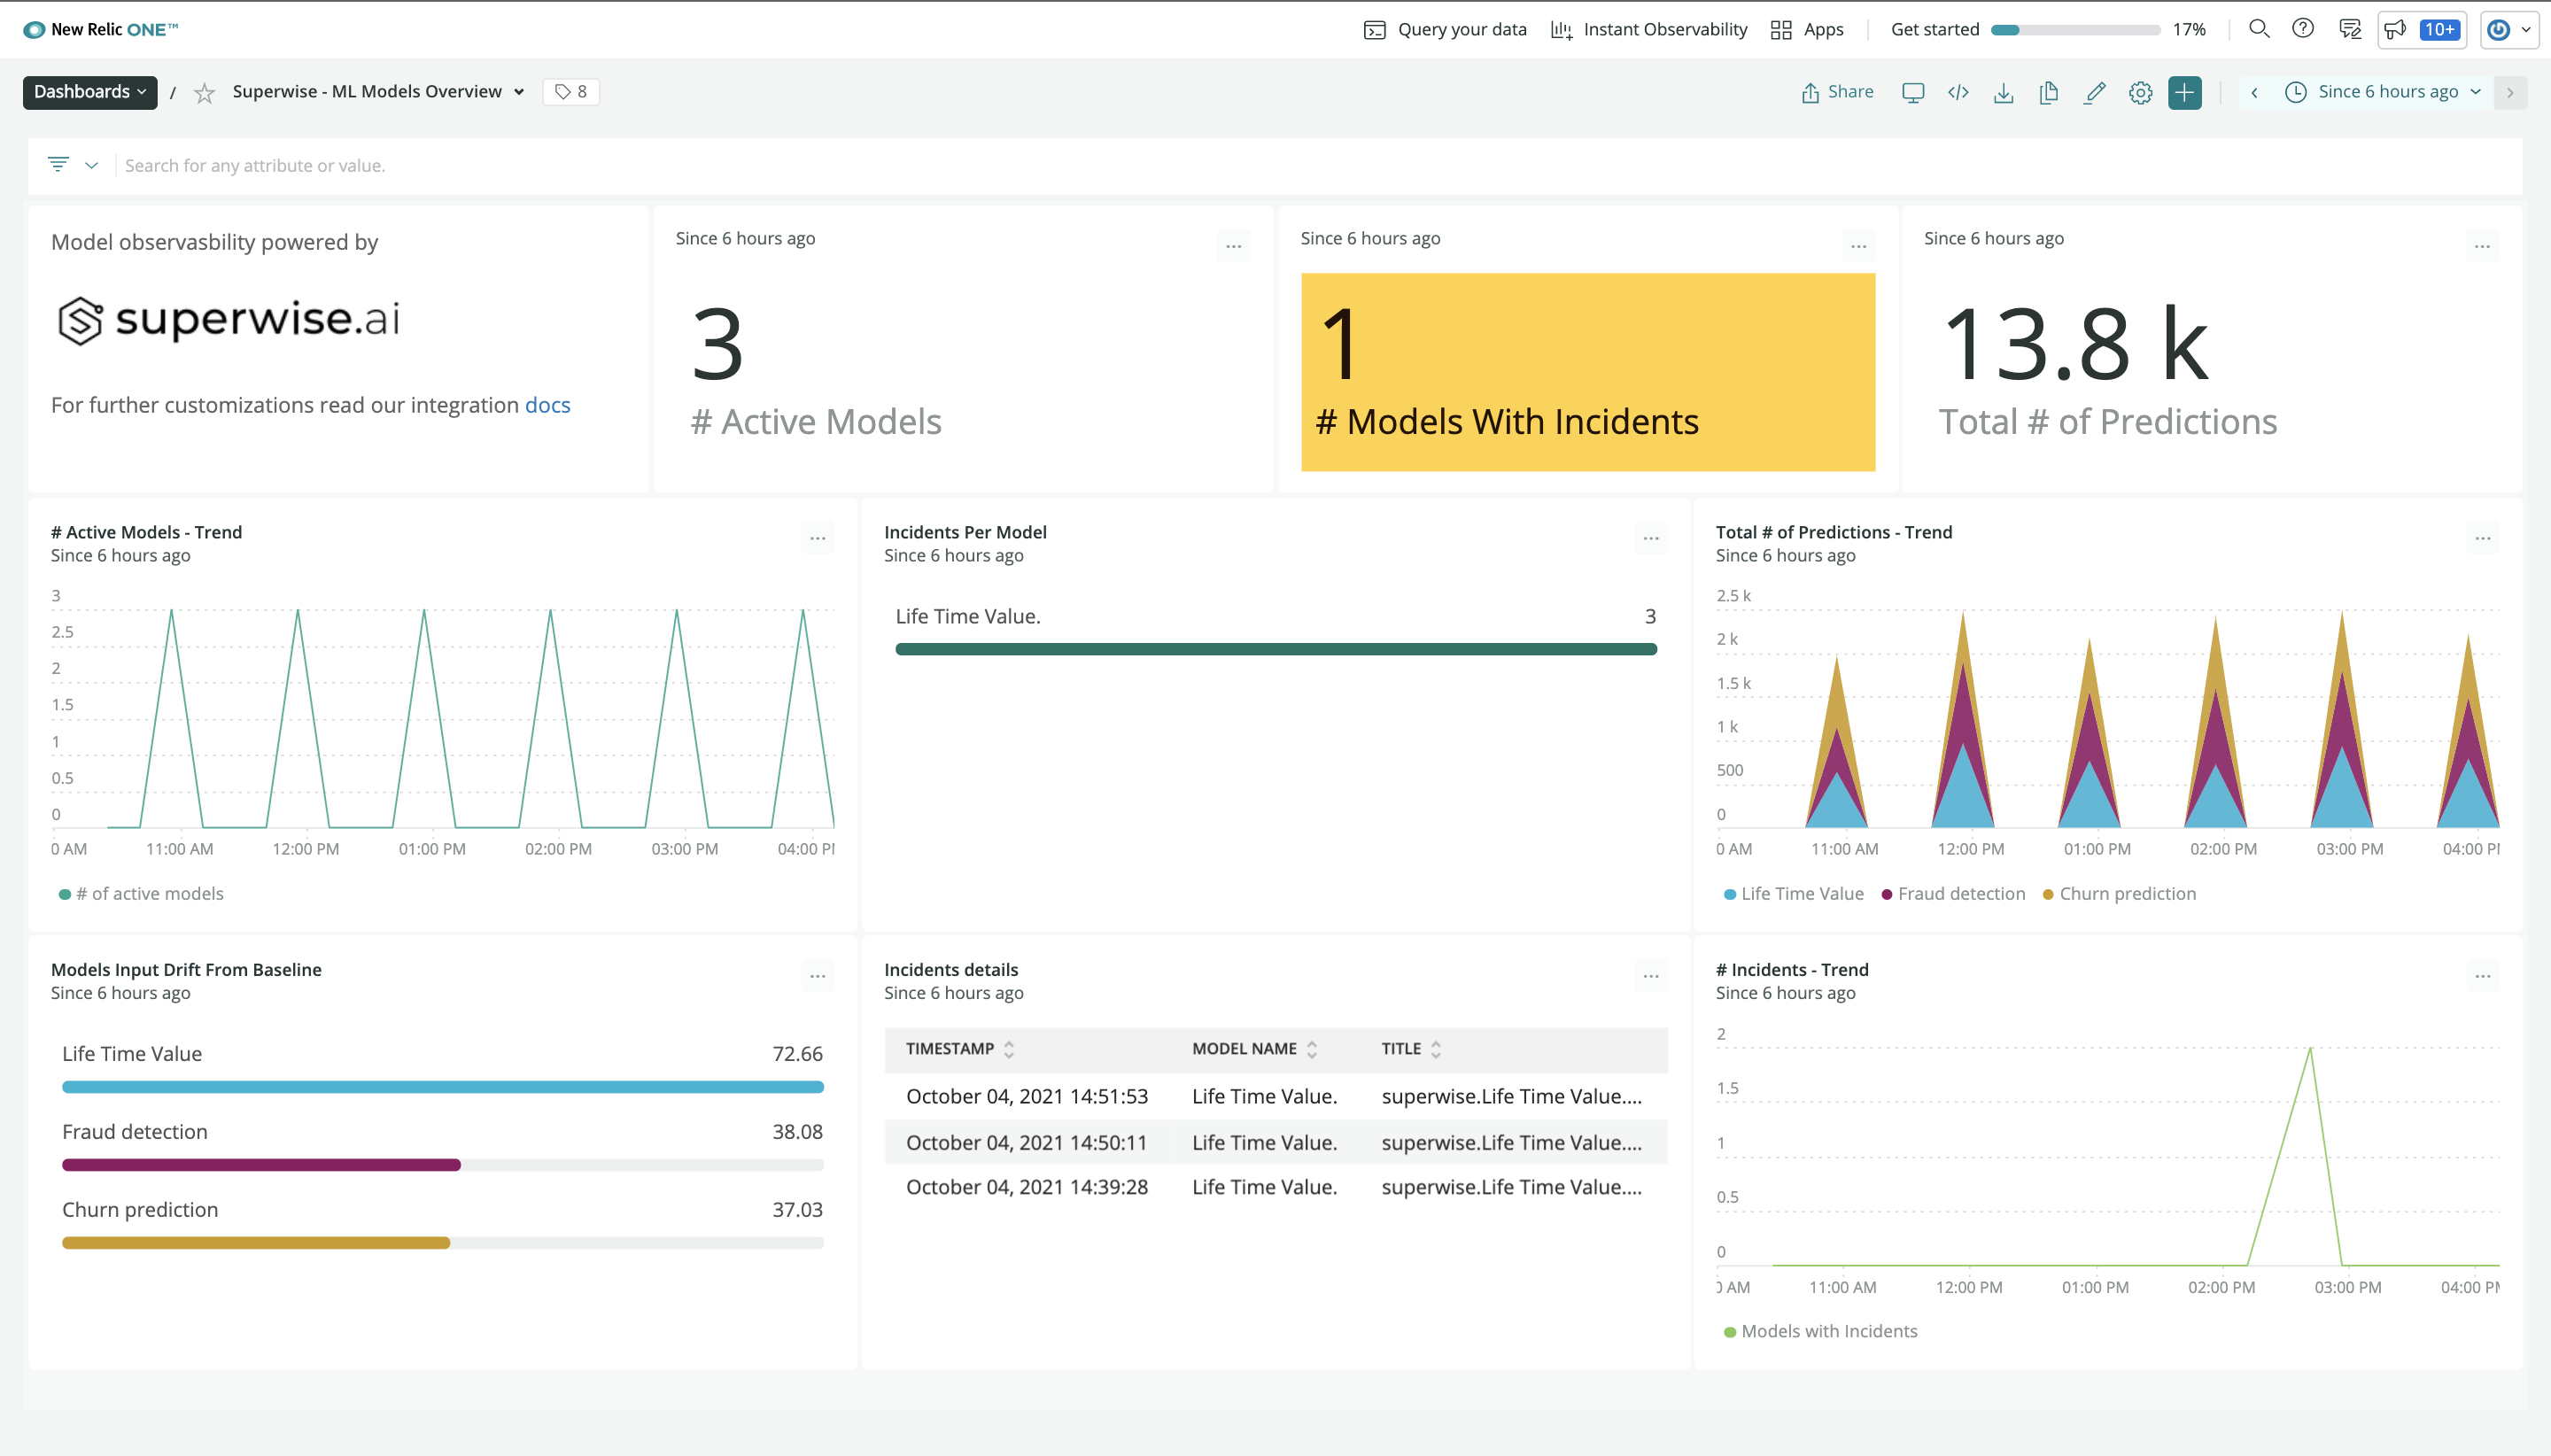
The model observability dashboard gives you out-of-the-box information regarding your active models, their activity status, drift levels, and any open incidents detected for specific time intervals or filters. In addition, you can add any custom metric and incident you need to monitor for your specific use cases.
Model activity - Overview of model activity including the number of active models (models that had some production data during the filtered time), their activity (predictions) over time, and the total number of predictions during the filtered timeframe.
Drift detection - Superwise drift measures, enables users to detect the model drift level in production relative to the baseline (e.g. training dataset). The drift measure is scaled between 0-100 and is based on Superwise’s unique drift metric. Using the model input drift chart, users can identify what models are drifting and may require retraining.
Incidents - Using incident widgets, users can easily see how many models currently have open incidents (violations of any monitoring policy configured), how incidents are being distributed among the different models, and drill down into the model incident details. The incidents that are included in this dashboard are only the ones that were configured explicitly to be sent to New Relic. To read more about how to define which incidents should be sent to New Relic, read more here.
4. Customize metrics and incidents you would like to send
Teams can easily customize any model metric and incident types available within the Superwise platform and share them on their New Relic dashboard to gain full MLOps visibility customized for your business context.
Prerequisite
If you didn’t configure your New Relic channel before this step you will be redirected to do so now.
Add / Remove metrics
To do that, follow these steps:
- Go to the specific model you want to add/delete metrics from.
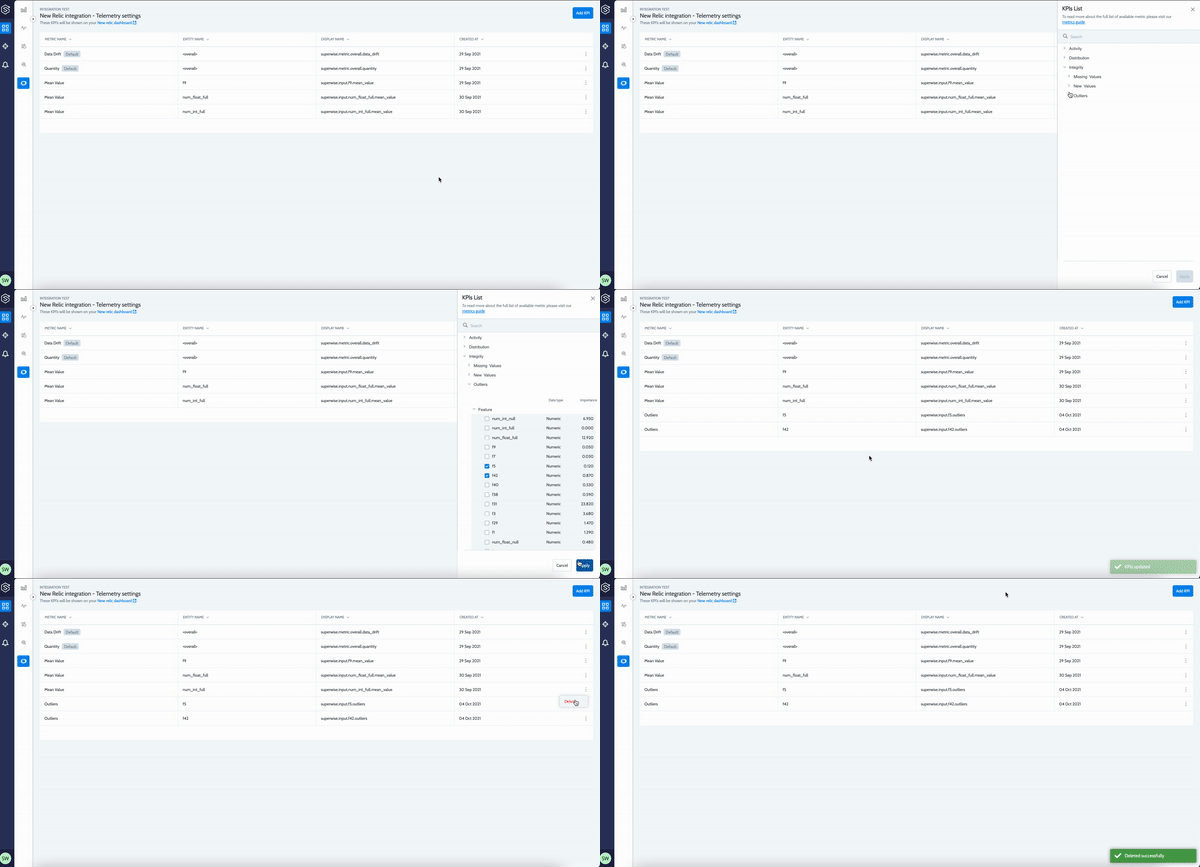
- Go to the "New Relic - Model Metrics". Here you can see the metrics belonging to the specific model that you have chosen to send to New Relic. As you can see, all models have few “default” metrics that will always be sent. These “default” metrics cannot be deleted.
- To add a new metric to the integration, choose the “Add KPIs” button. Use our KPI menu to choose the specific KPIs you would like to share with New Relic. Once done the metric will be sent now automatically going forward.
To explore and visualize the metric within your New Relic dashboard:
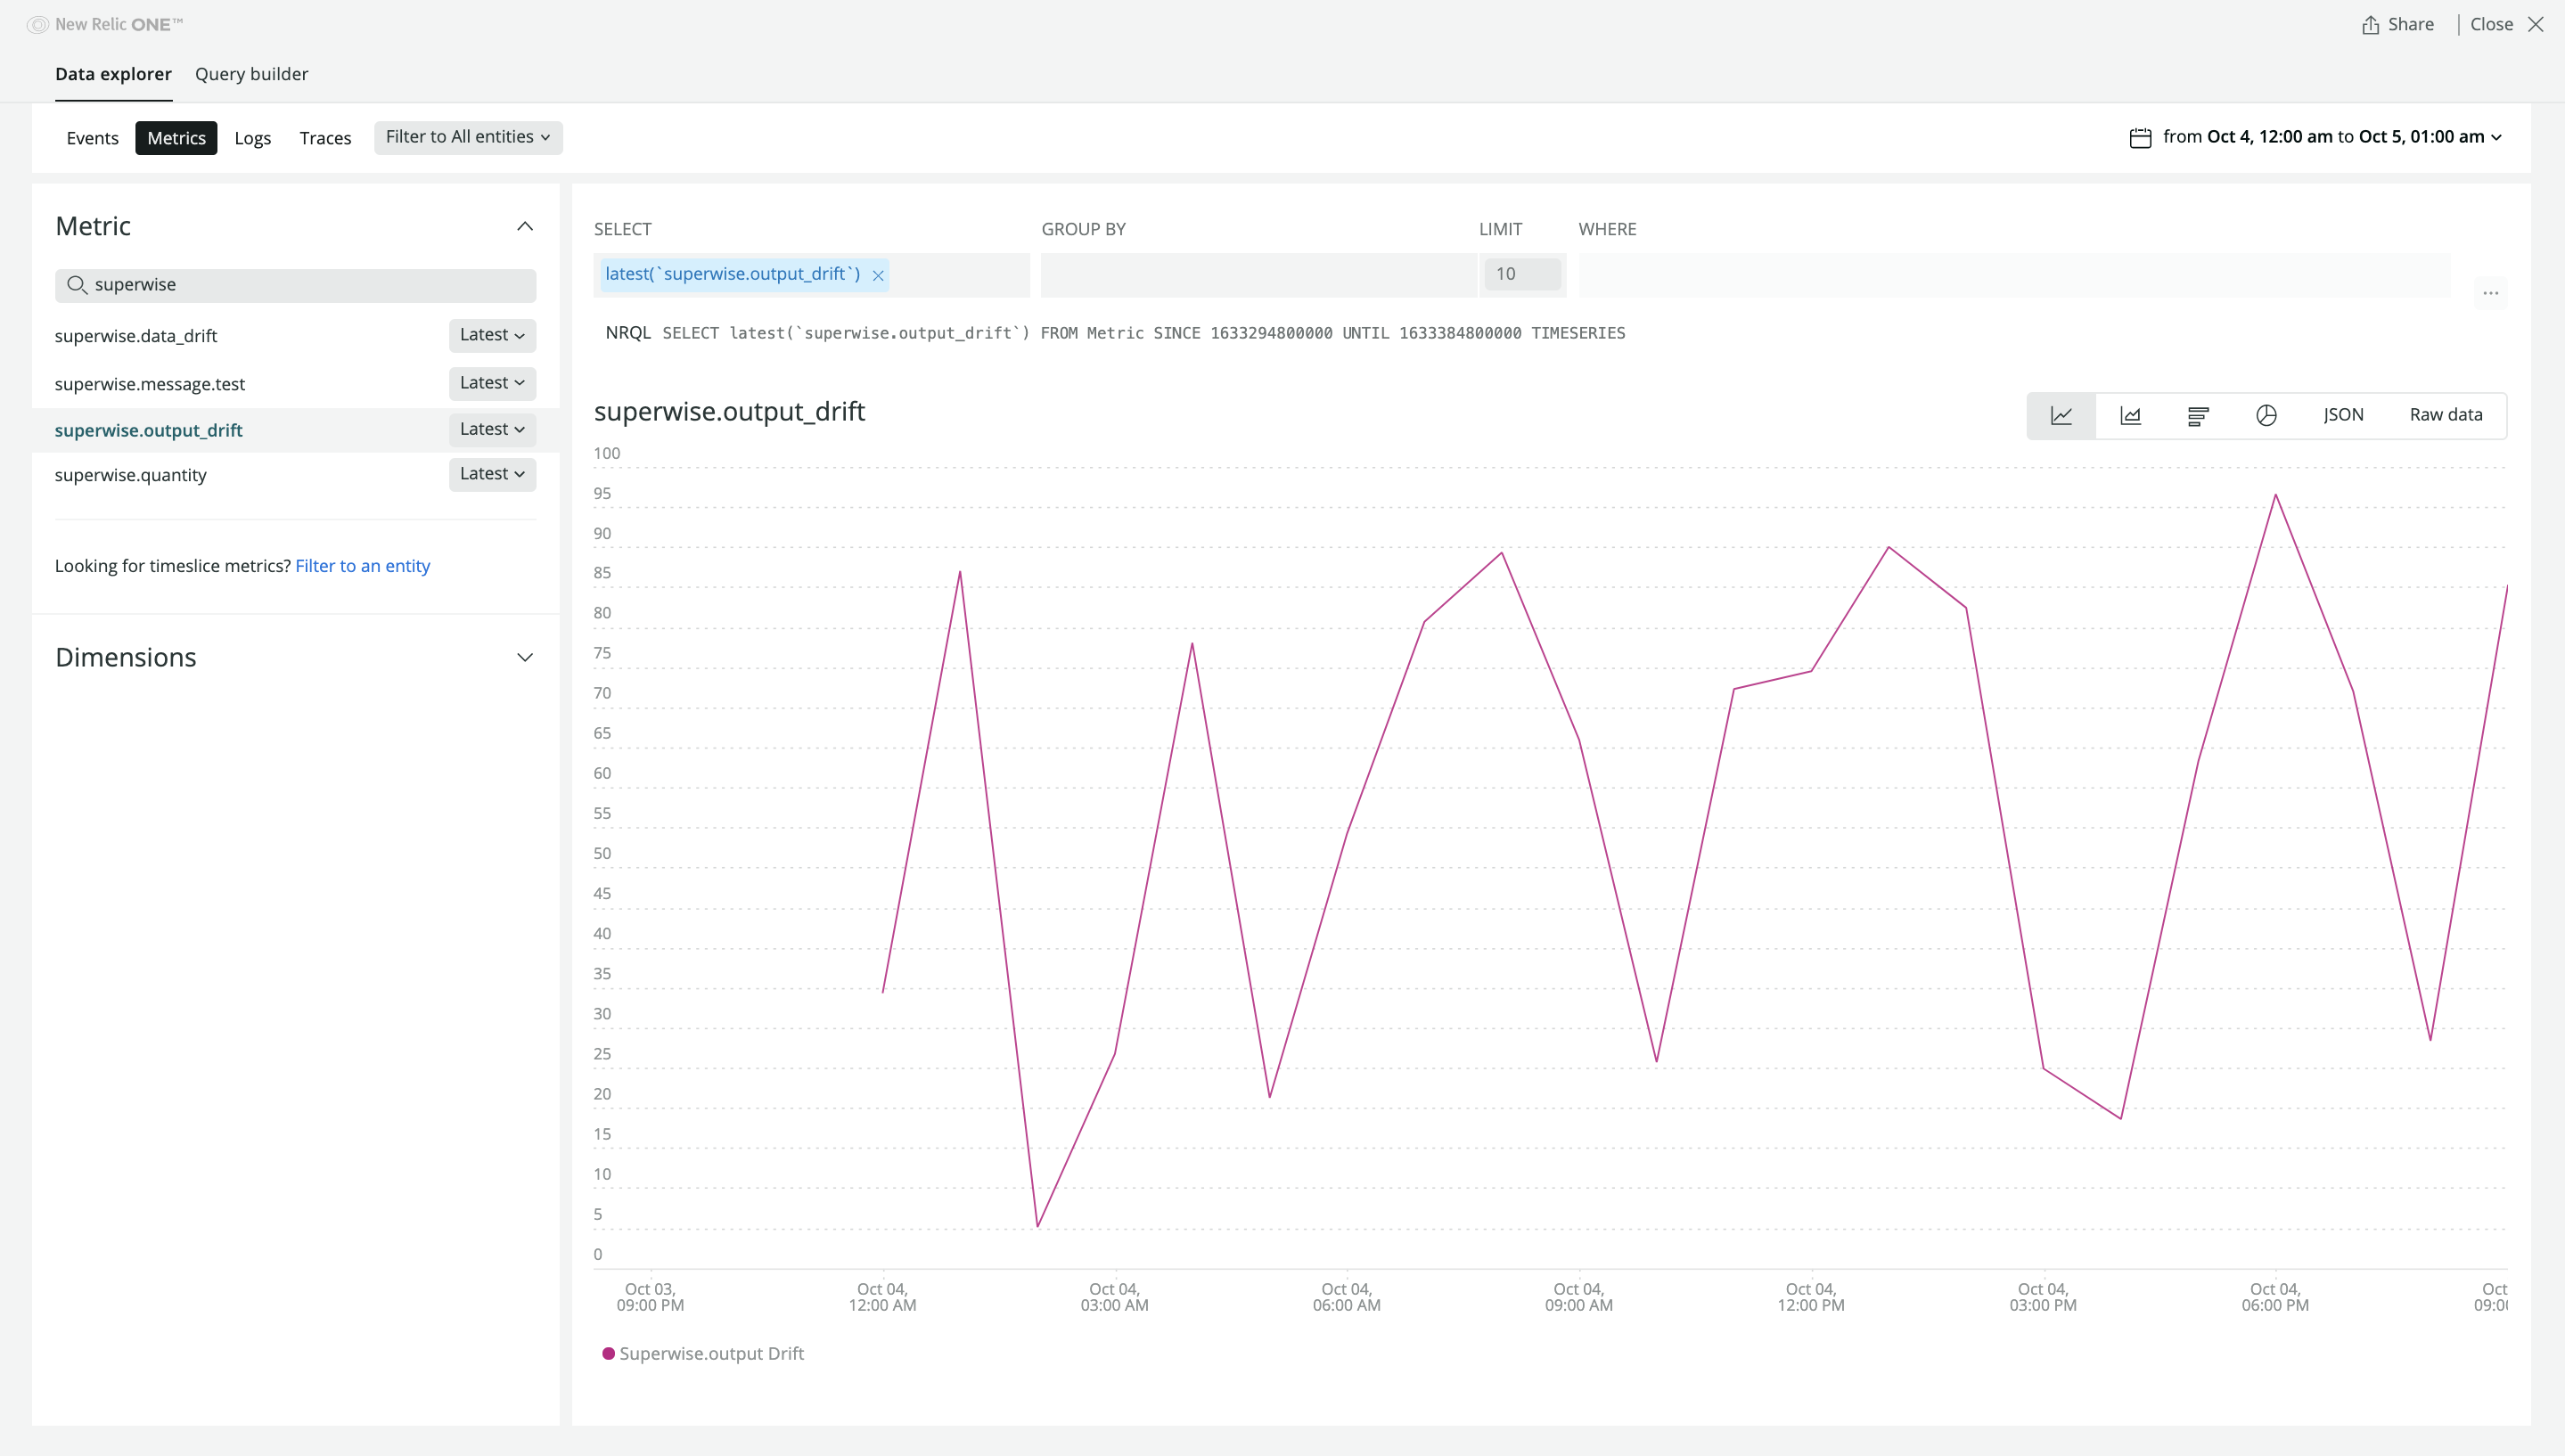
Go to New Relic and select “Browse Data” and then choose "Metrics".
To search for a specific metric you want to visualize, use the Display name provided on the Model Metric settings page in Superwise.
Send specific incidents to New Relic
Superwise’s flexible monitoring policy builder gives users the ability to configure different policies and send any detected incident into one or more downstream channels including New Relic, PagerDuty, Slack, Email, and more. You have full control over what policies are sent to which channels to ensure that the right team gets the right alert at the right time.
To configure a new policy to send incident notifications to New Relic follow the following steps:
-
Create a monitoring policy and choose New Relic as a notification channel:
> Set your policy name and settings
> Define logic. For example: Detect missing value anomalies in my top 5 features
> Define what channels, such as New Relic, you want incident notifications to be sent to -
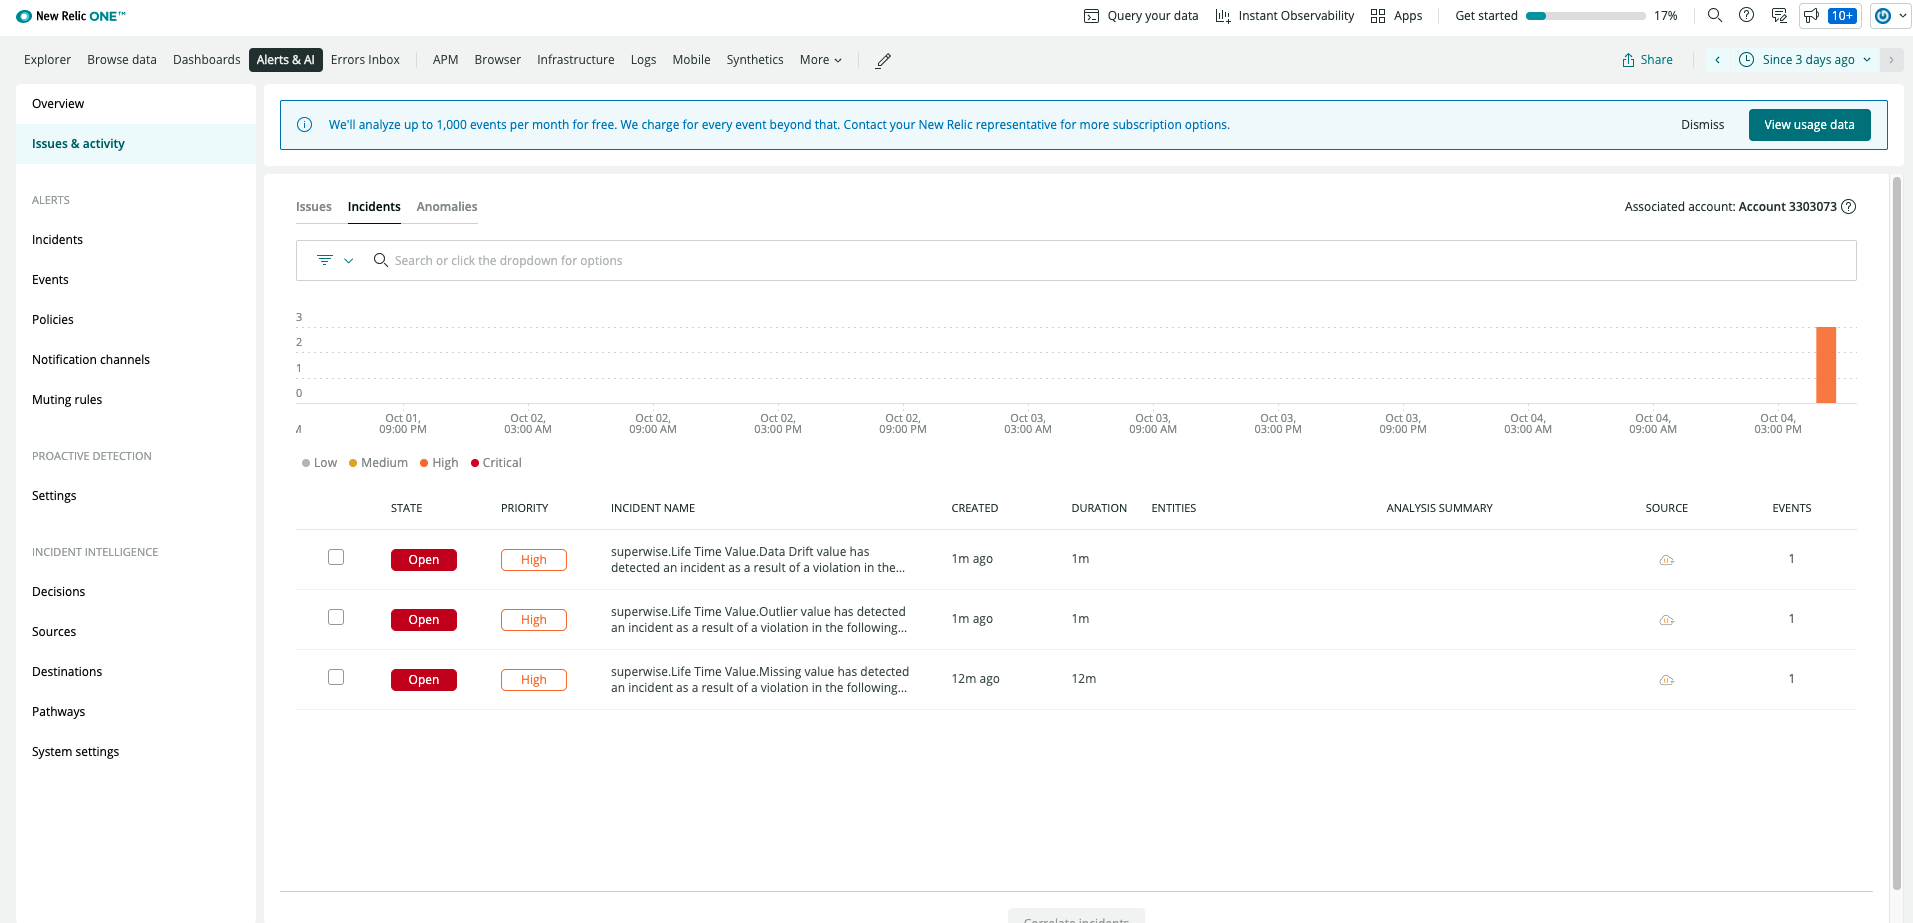
From now on, any new incident that was configured to be sent to New Relic will be available both in the Superwise model observability dashboard and as an integral part of the New Relic incident insights section:
> Go to “AI & Alerts”

> Choose “Issues and activity” and then select the “Incidents” tab
Updated almost 4 years ago
