Datadog
Integrating Superwise into Datadog
Superwise’s model metrics and incidents integration streamline results of our out-of-the-box model metrics, including drift, activity, incidents, and any custom metrics you configure, directly into Datadog. You’ll get an immediate overview of which models are misbehaving that can be tailored to any use case, logic, segmentation, threshold, and sensitivity.
How it works
Once a user configures the Datadog integration in Superwise, standard model metrics are sent to Datadog and users get model observability dashboards within Datadog. Users can also configure any specific model metric and incident policy and send them to Datadog for model observability tailored to their business context.
To set up the integration follow these steps:
[1 - Generate Datadog API tokens.] (#Step1)
[2 - Create Datadog integration channel.] (#Step2)
[3 - Explore, monitor, and detect issues in your ML observability dashboard within Datadog.] (#Step3)
This dashboard is generated automatically for standard metrics like drift, activity, and active models.
(Optionally, but definitely recommended)
You’ll always get our standard model metrics and dashboard but you can build on that with logic, segments, and thresholds to tailor Superwise model observability to your use cases.
The following guide will take you step by step, through integrating and customizing the Datadog integration.
1. Create Datadog API tokens in Datadog
In order to be able to share incidents and metrics from Superwise to Datadog, and easily build model observability dashboards within Datadog, you have to provide Superwise with your Datadog's API keys.
There are 2 types of API keys you need to extract from your Datadog account
(1) API Key - enables sharing monitoring metrics and events between Superwise and Datadog
(2) Application Key - enables sharing incidents between Superwise and Datadog
In your Datadog account, go to Organization Settings > API-Keys or go to https://app.datadoghq.com/organization-settings/api-keys
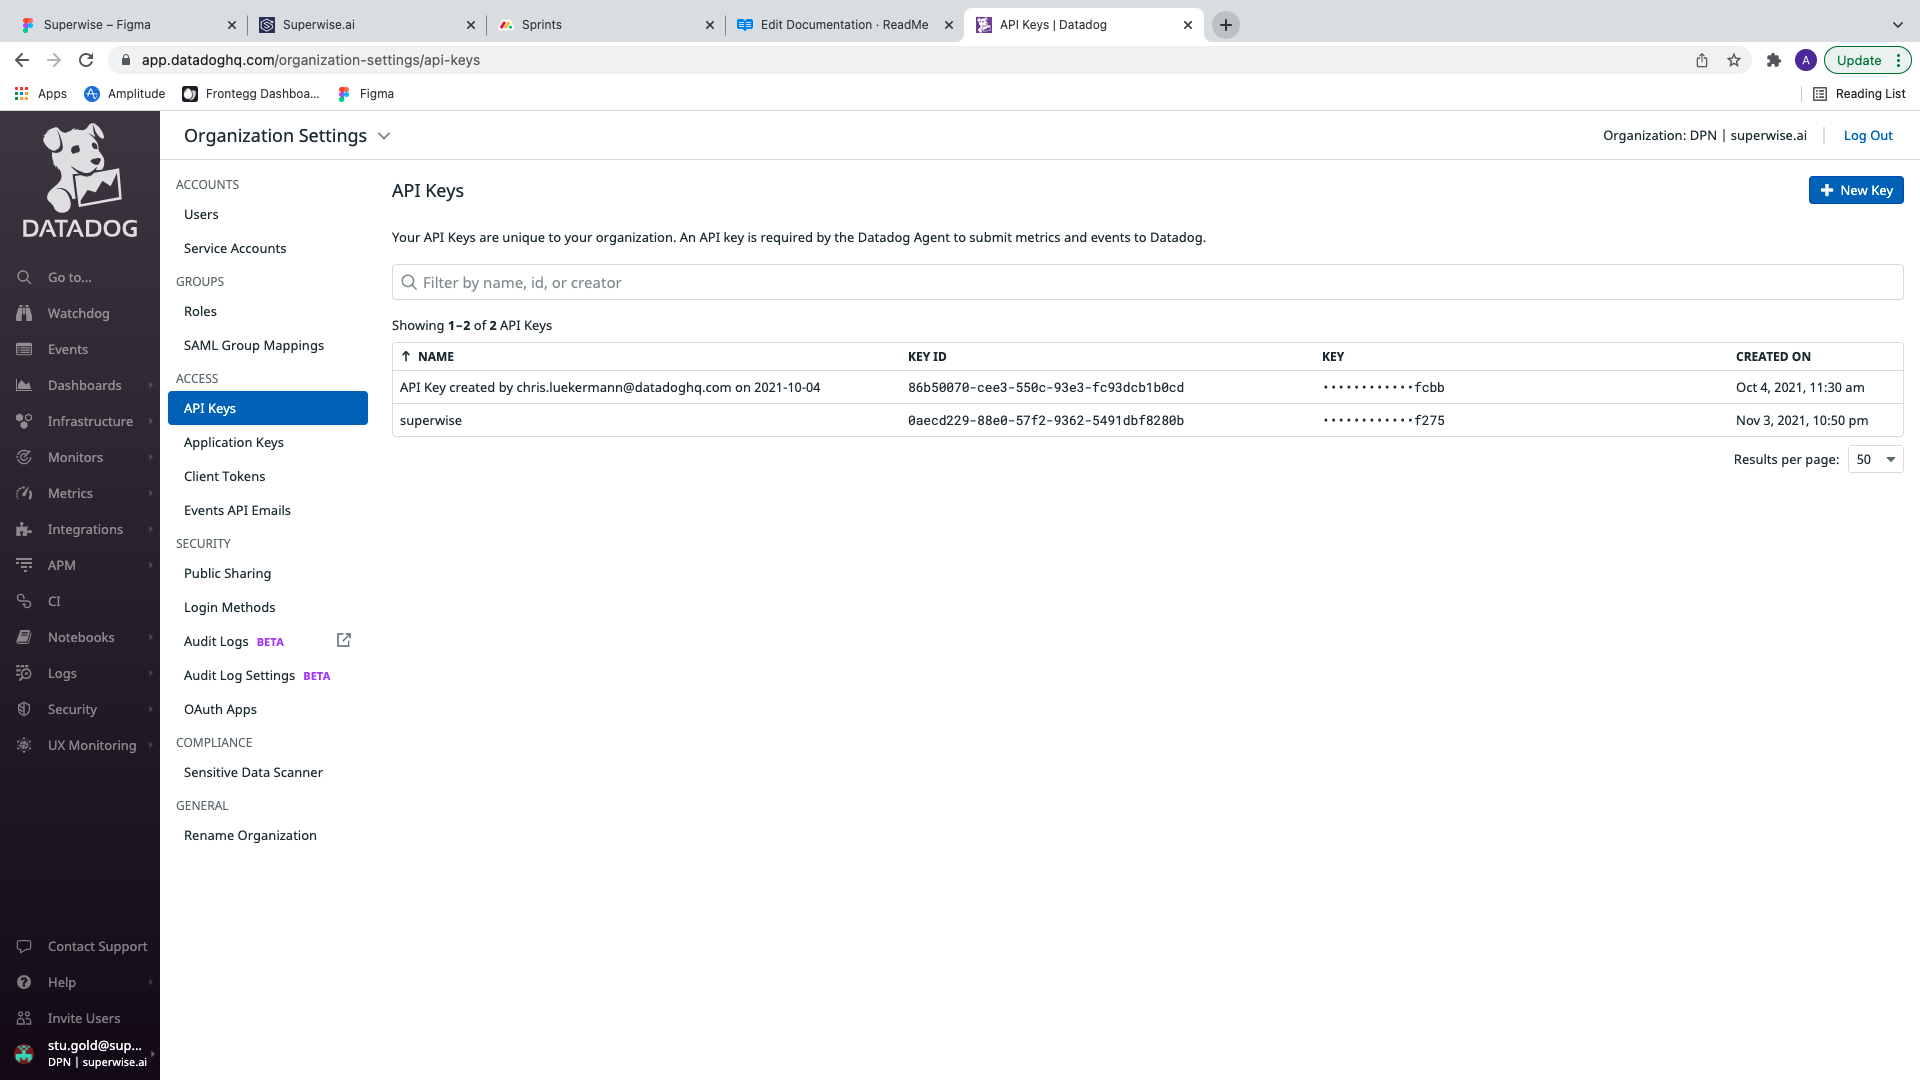
Click on "+New Key" button to add API/Application Keys. Start by naming the Key (preferably a meaningful name such as "Superwise" or "Model Observability"). Once you do that, a key will be generated for you.
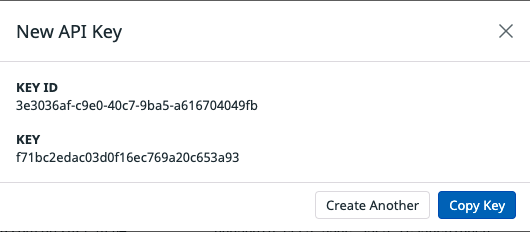
The same process should be done for the Application Key, in the Application Key window.
Great! You are halfway there. In the following step, you will paste the Datadog tokens you generated into your Superwise account.
Don't close the Datadog window yet
Keep the Datadog screen open as you’ll need it for the next steps where you’ll configure these tokens on the Superwise side to finish the integration.
2. Configure Datadog integration in Superwise
Datadog should be configured as a notification channel in Superwise so that all monitoring data and incidents will be sent to Datadog.
Configure a Datadog channel:
- In Superwise - go to Notification channel settings (Integrations tab).
- Click on " Create a new channel"
- Select Datadog
- Enter a channel name and input the two Datadog tokens you just created during the previous step in Datadog (API Key and Application Key).
- Click on the Test button. The Test button will send a dummy request to your Datadog account to validate the integration. You should get a success message both in Superwise and in your Datadog account. To finish the setup click “Create channel”.

That’s it :) You should now see a Datadog notification channel in the integrations screen.

Test Request
In case of failure, due to wrong API Key or Application Key - you will get an error notification within Superwise, saying "Test failed, invalid tokens provided"
You can always run additional test requests by clicking on the 3-dots icon on top right side of the Datadog channel box in the "Integrations" screen, and then clicking on "Test"
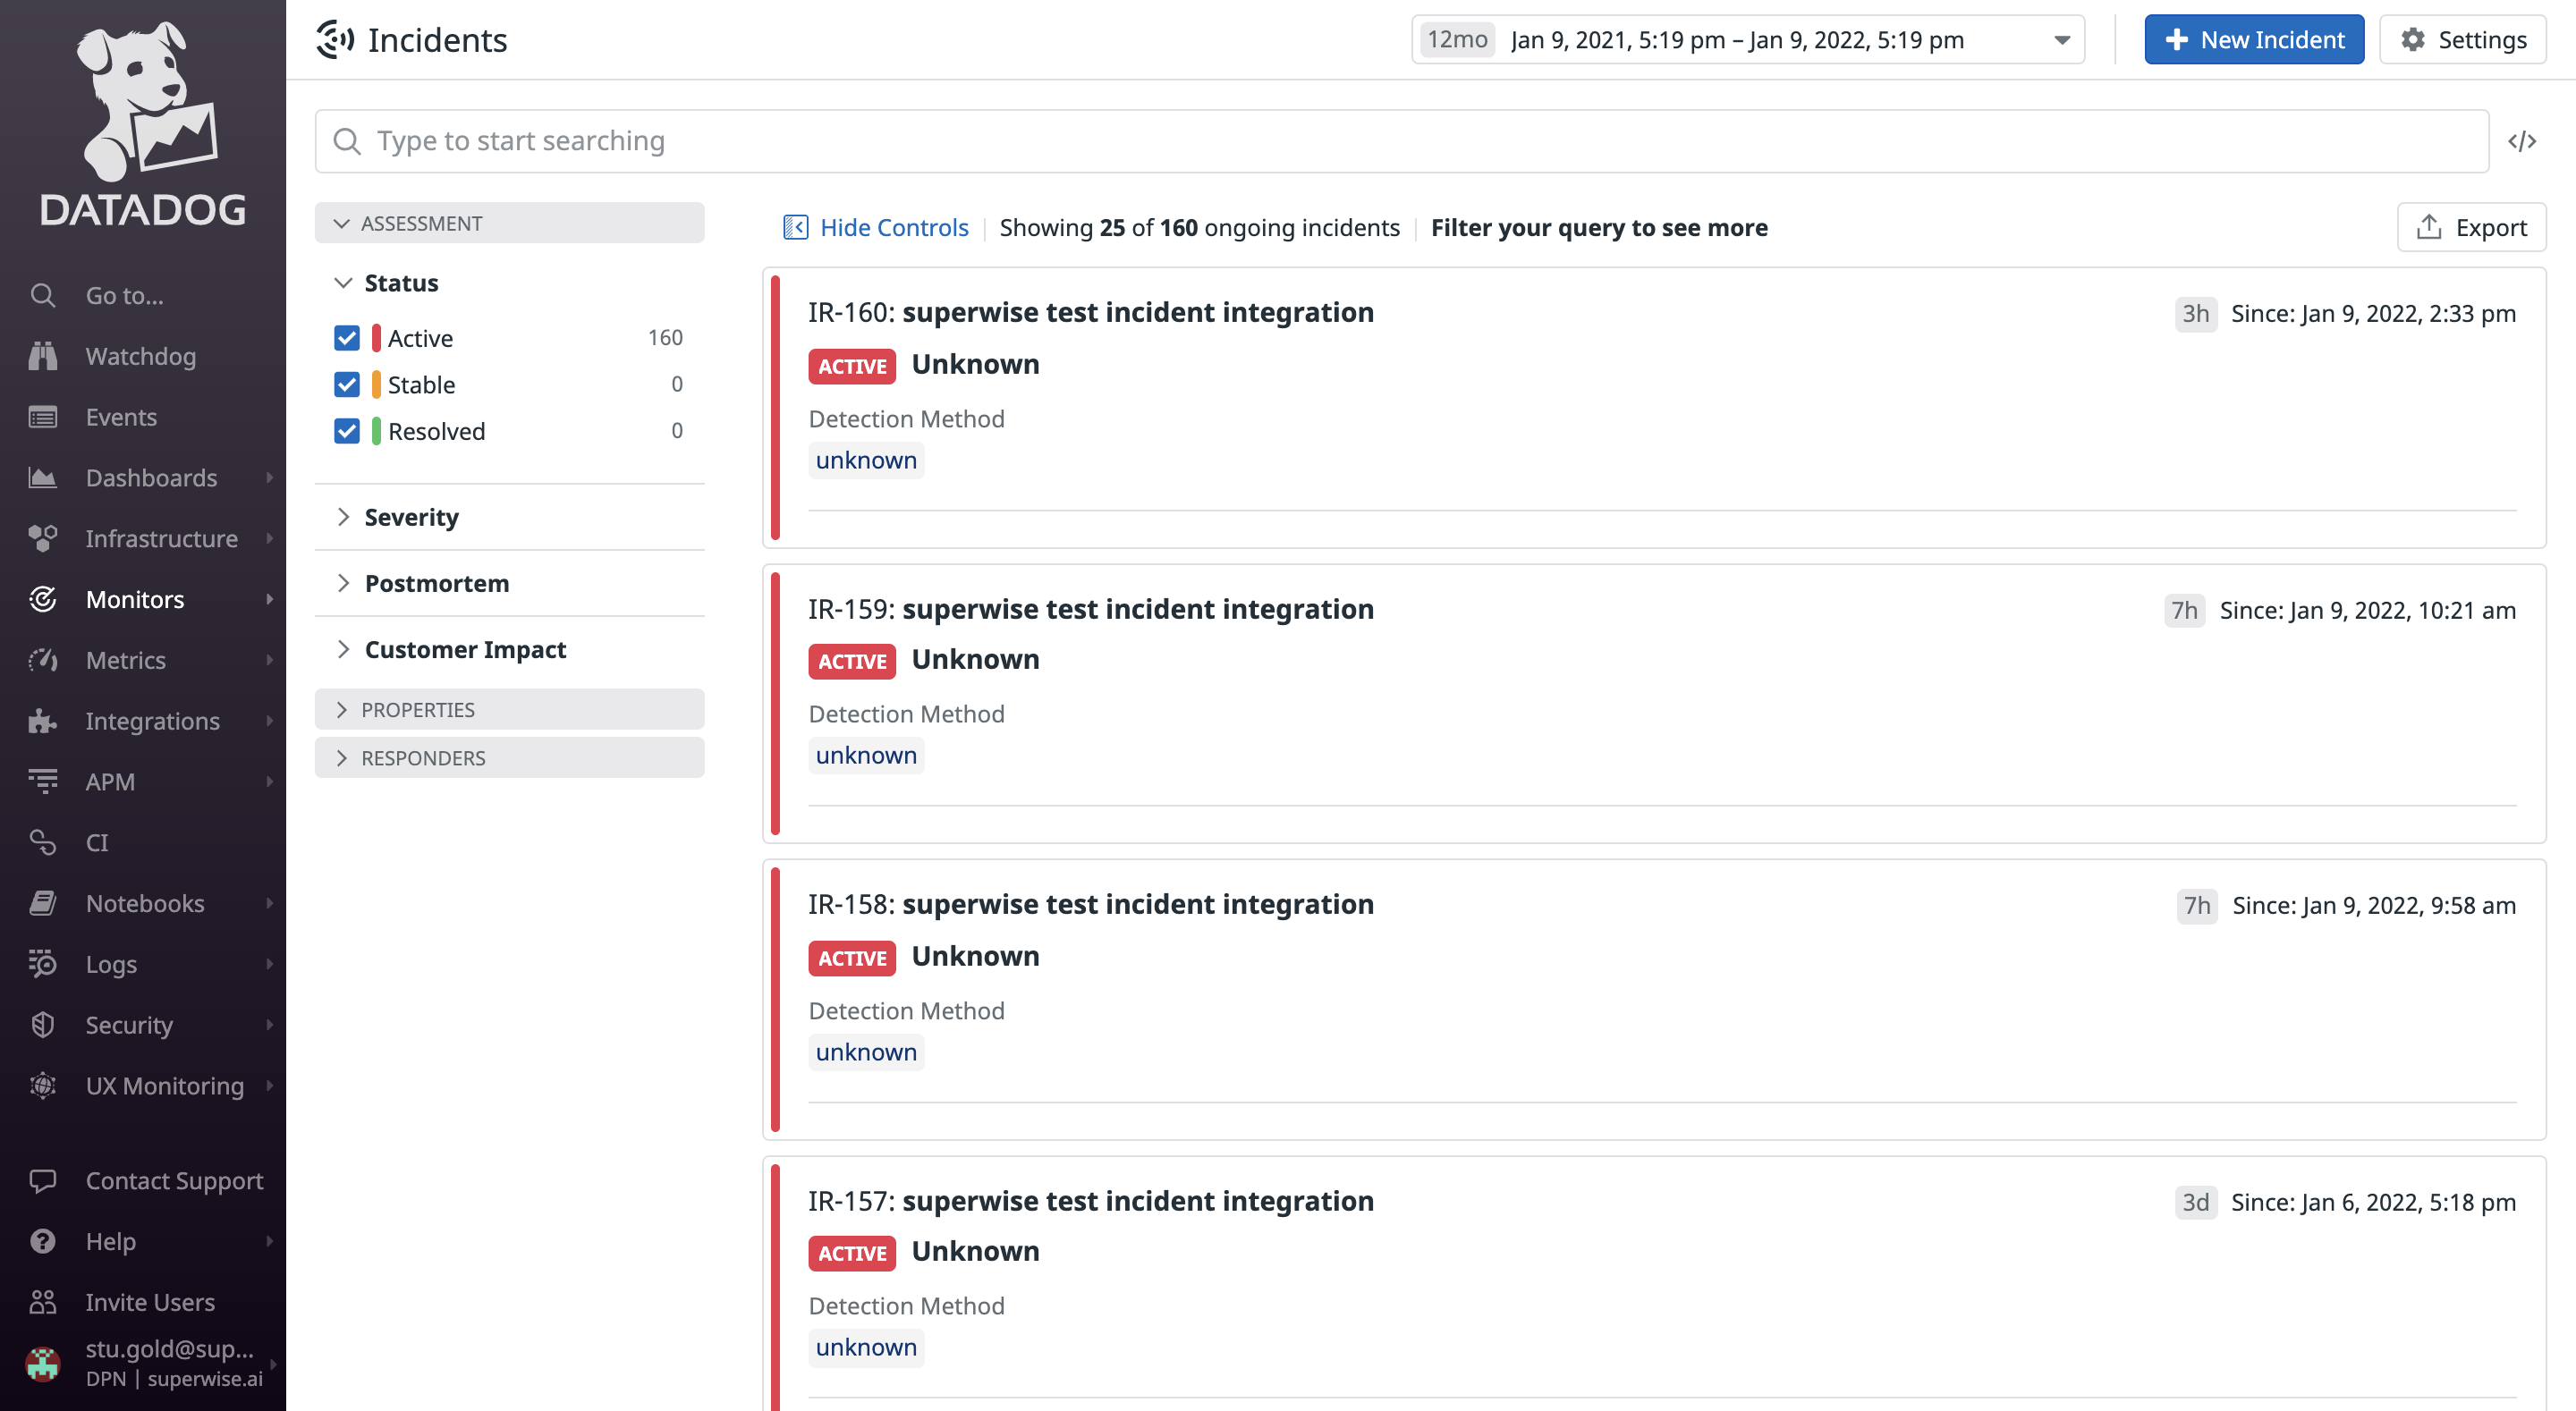
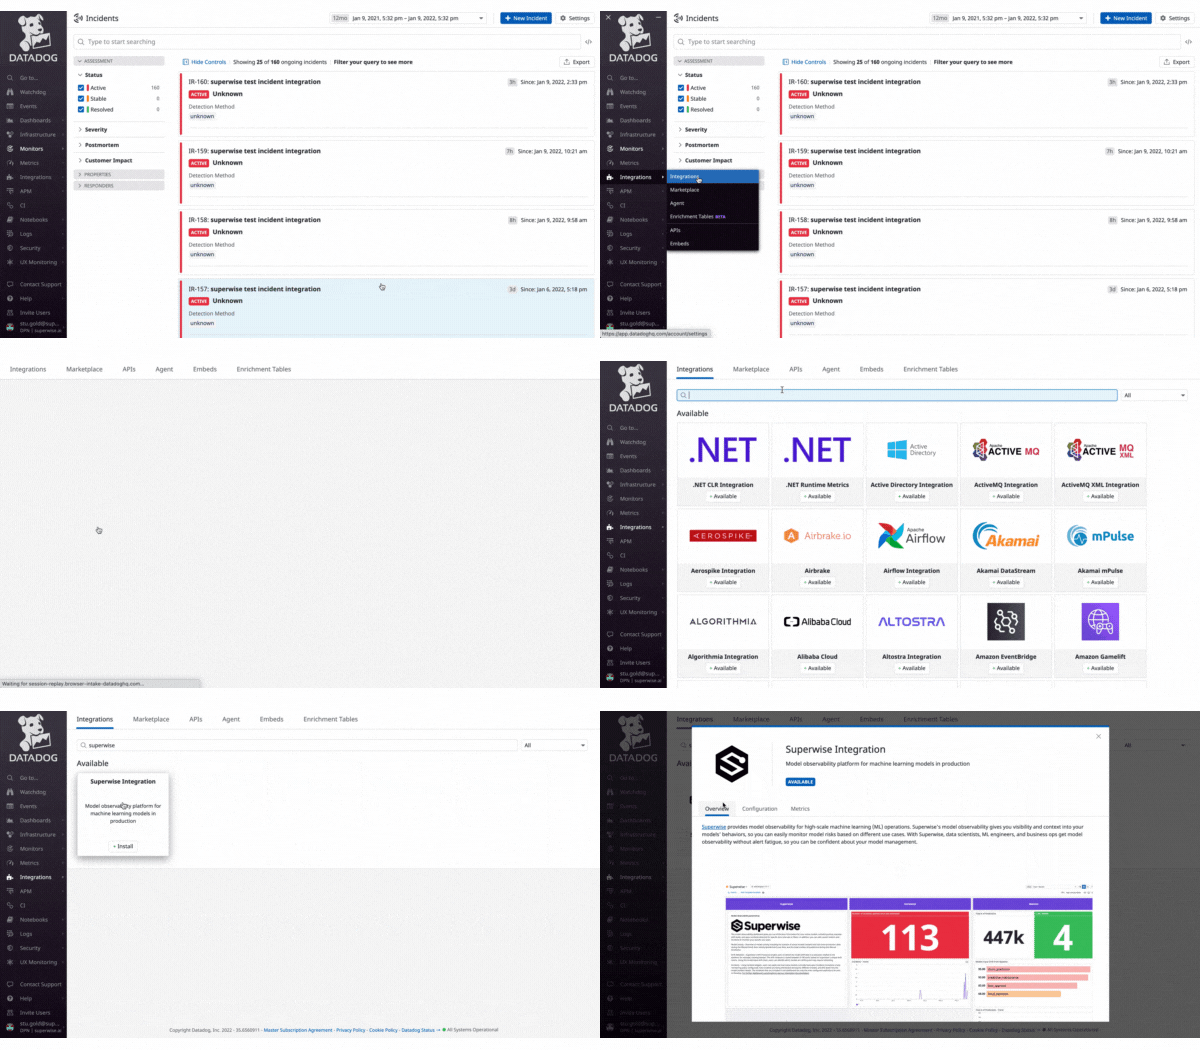
In order to verify connection between Superwise andDatadog from your Datadog environment - simply click on the "Monitor" tab (on the main-menu), and choose "Incidents" in the sub-menu.
In the Monitor>Incidents window, you should see the tests requests arrived from Superwise (make sure you configure the correct time-frame on the top-right side of the screen, to the time when the tests were made).
3. View and explore your Superwise model observability dashboard
Go to the Datadog integration screen by clicking on "Integrations" in the main-menu, and then selecting "Integrations" .
Search for "Superwise" and click on it to install. Hit install again inside the pop-up that describes the Superwise package to start the installation.
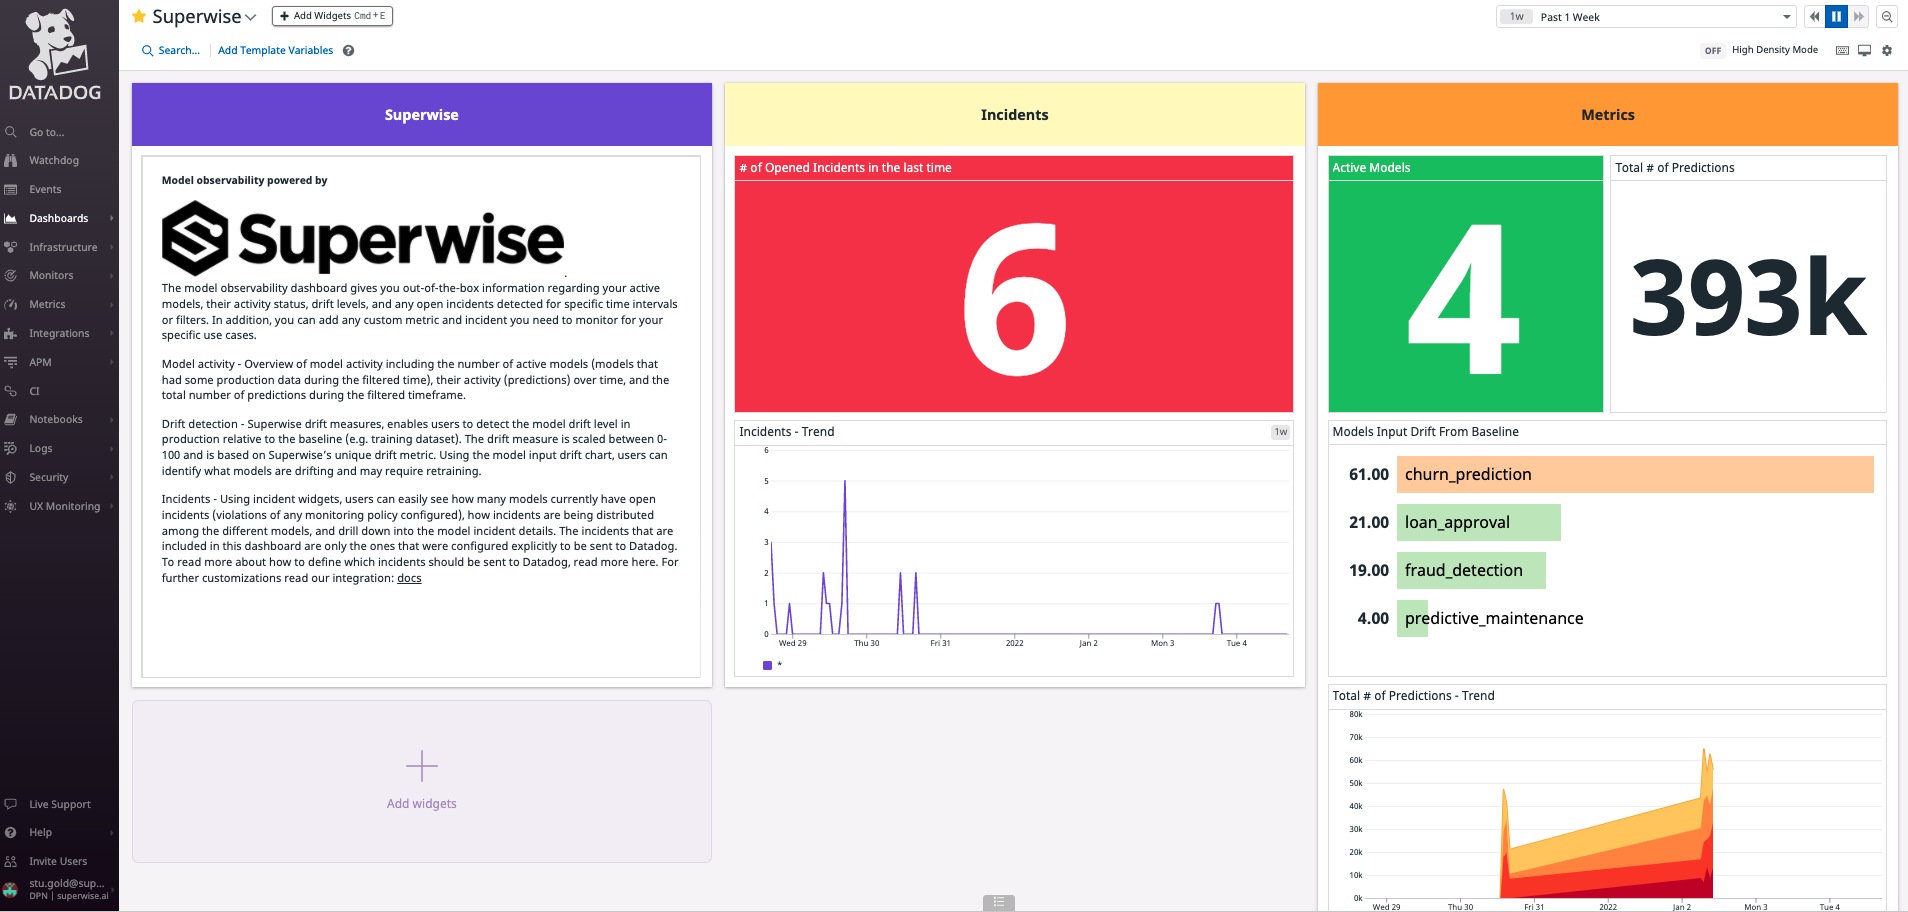
Entering your newly added Superwise dashboard within Datadog is super easy - In the main-menu, click on Dashboards>Dashboard List, and in there - a pre-configured "Superwise" dashboard will appear. Select it to see your Superwise model observability dashboard:
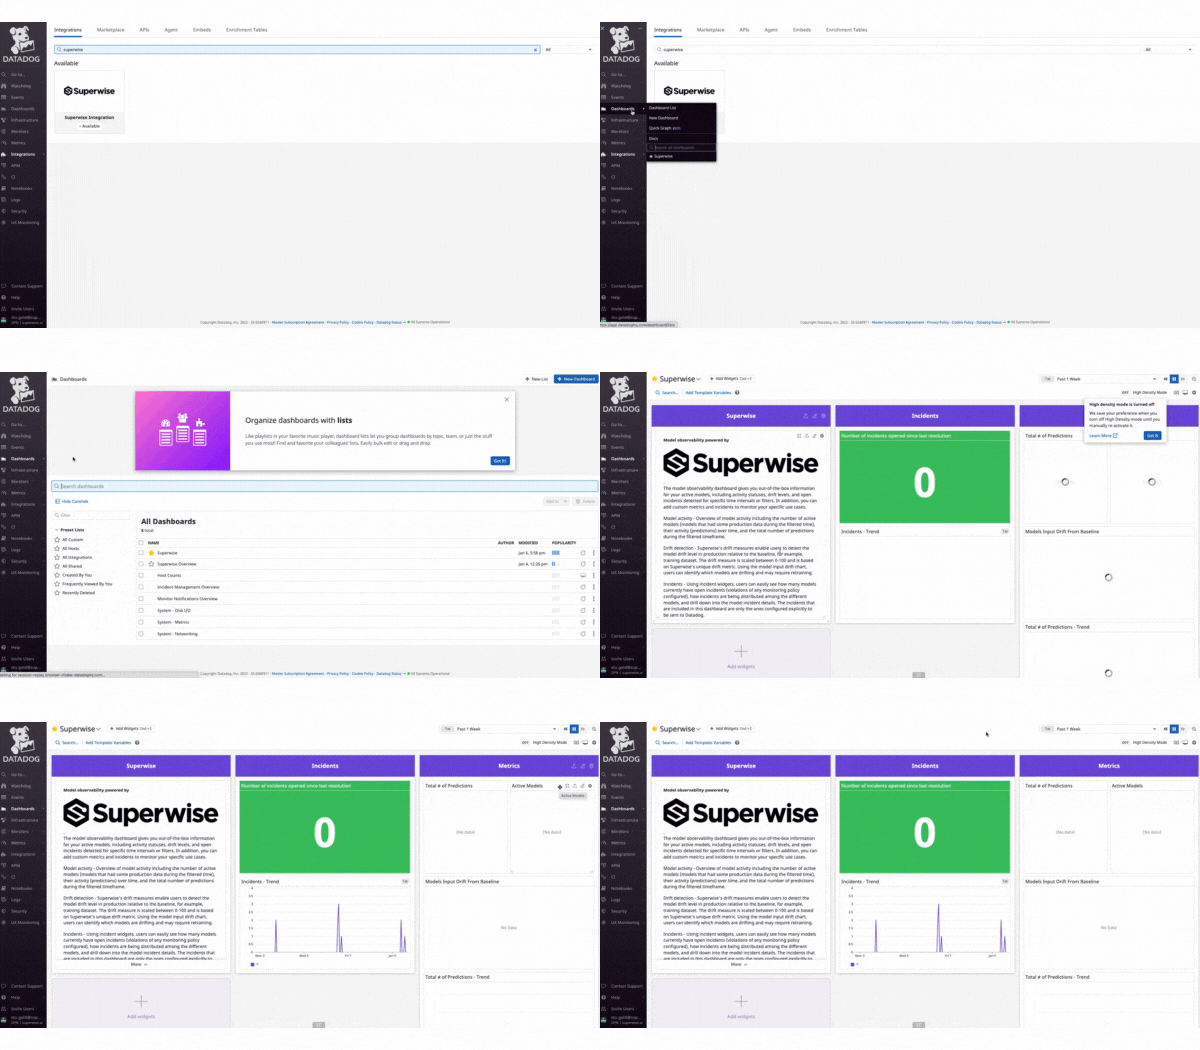
The model observability dashboard gives you out-of-the-box information regarding your active models, their activity status, drift levels, and any open incidents detected for specific time intervals or filters. In addition, you can add any custom metric and incident you need to monitor for your specific use cases.
Model activity - Overview of model activity including the number of active models (models that had some production data during the filtered time), their activity (predictions) over time, and the total number of predictions during the filtered timeframe.
Drift detection - Superwise drift measures, enables users to detect the model drift level in production relative to the baseline (e.g. training dataset). The drift measure is scaled between 0-100 and is based on Superwise’s unique drift metric. Using the model input drift chart, users can identify what models are drifting and may require retraining.
Incidents - Using incident widgets, users can easily see how many models currently have open incidents (violations of any monitoring policy configured), how incidents are being distributed among the different models, and drill down into the model incident details.
4. Customize metrics and incidents you would like to see
Teams can easily customize any model metric and incident types available within the Superwise platform and share them on their Datadog dashboard to gain full MLOps visibility customized for your business context.
Pre-requisite
If you didn’t configure your Datadog channel before this step you will be redirected to do so now.
By default - all metrics are shared with Datadog, so you only need to configure what would you like to see on your dashboard.
Add / Remove metrics
To do that, follow these steps:
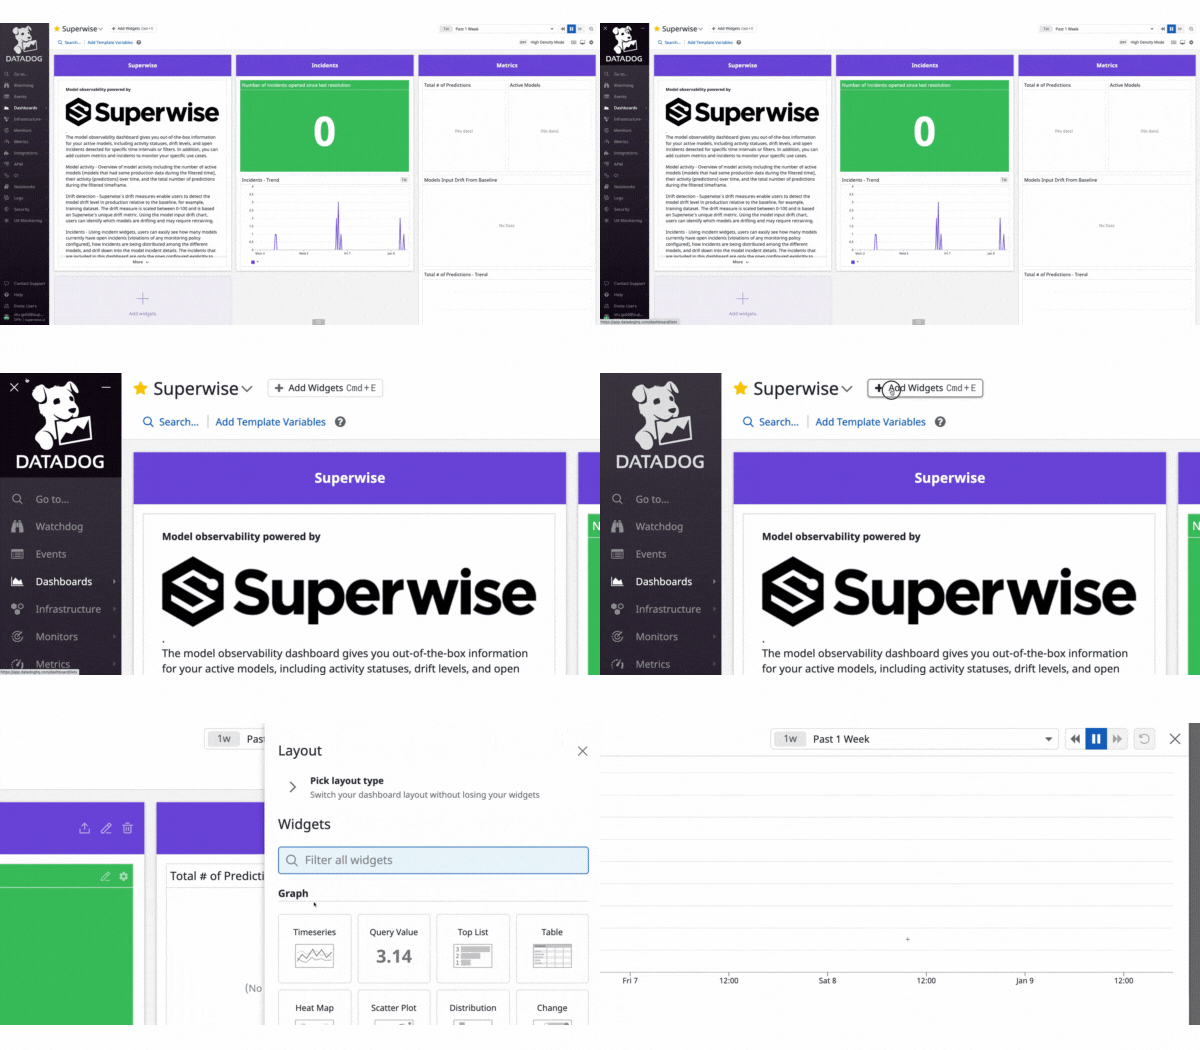
- Go to the Superwise dashboard you have created in Datadog
- Click on "+Add Widget" button (or hit Cmd+E)
- Select the graph type you would like to visualize your data with (see GIF below)
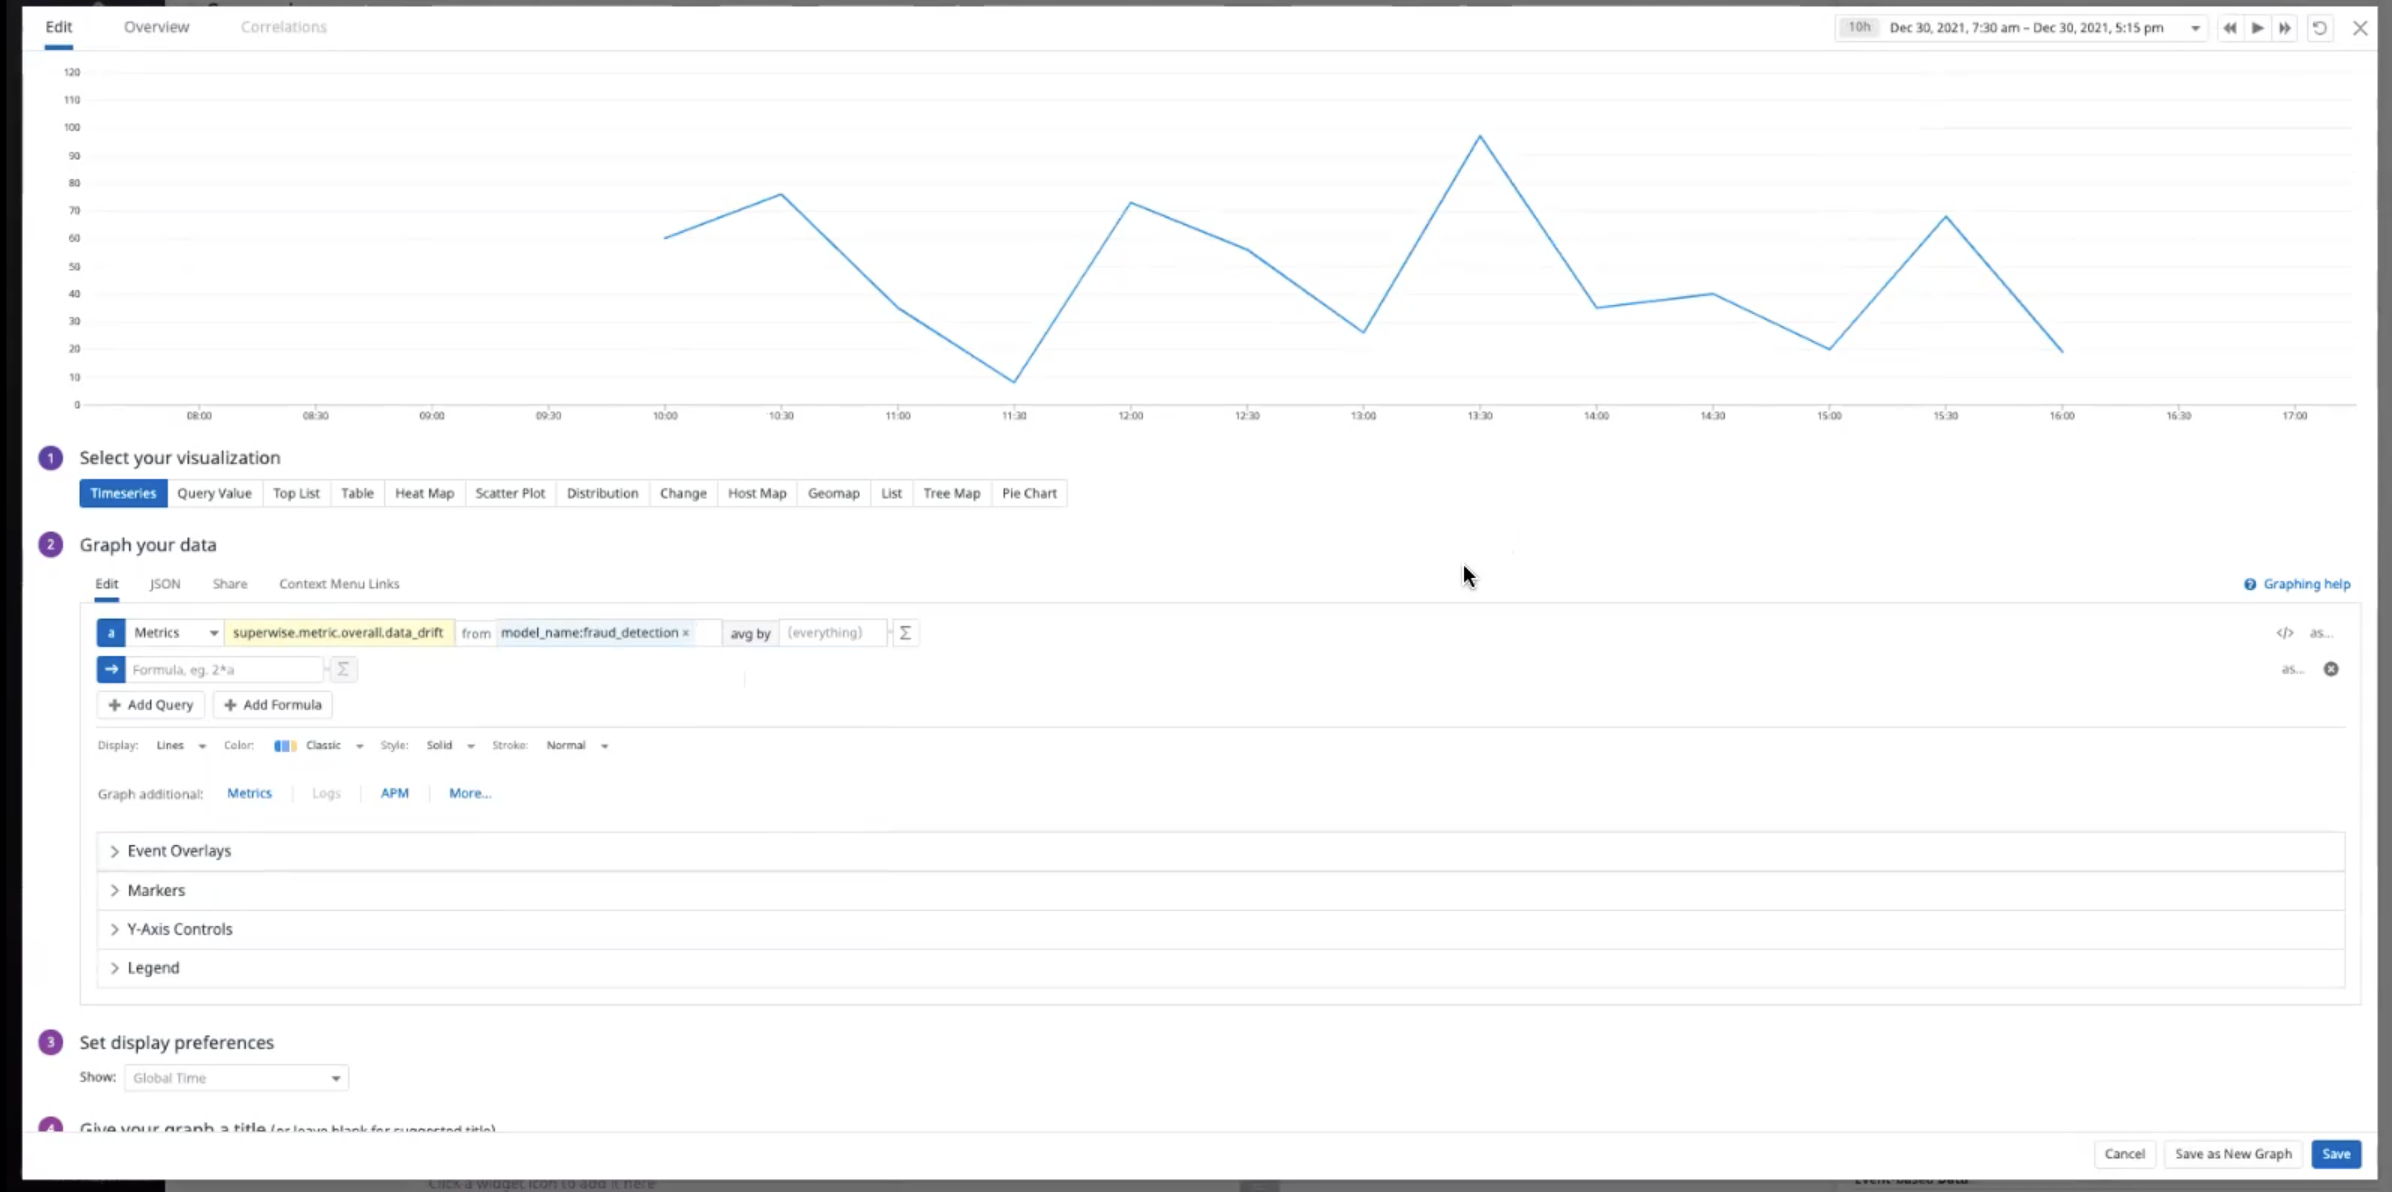
- In the metric field, search for the specific metric you want to visualize by using the display name provided on the Model Metric settings page in Superwise. You should enter "superwise.metric.<Metric_name>" - for example, superwise.metric.overall_input_drift.
In the next field ("From") - enter the name of the model you wish to fetch metrics for. You should enter "model_name:<Model name)>" - for example, model_name:fraud_detection*
Send specific incidents to Datadog
Superwise’s flexible monitoring policy builder gives users the ability to configure different policies and send any detected incident into one or more downstream channels including Datadog, PagerDuty, Slack, Email, and more. You have full control over what policies are sent to which channels to ensure that the right team gets the right alert at the right time.
To configure a new policy in Superwise to send incident notifications to Datadog follow the following steps:
-
In Superwise, create a monitoring policy and choose Datadog as a notification channel:
> Set your policy name and settings
> Define logic. For example: Detect missing value anomalies in my top 5 features
> Define what channels, such as Datadog, you want incident notifications to be sent to -
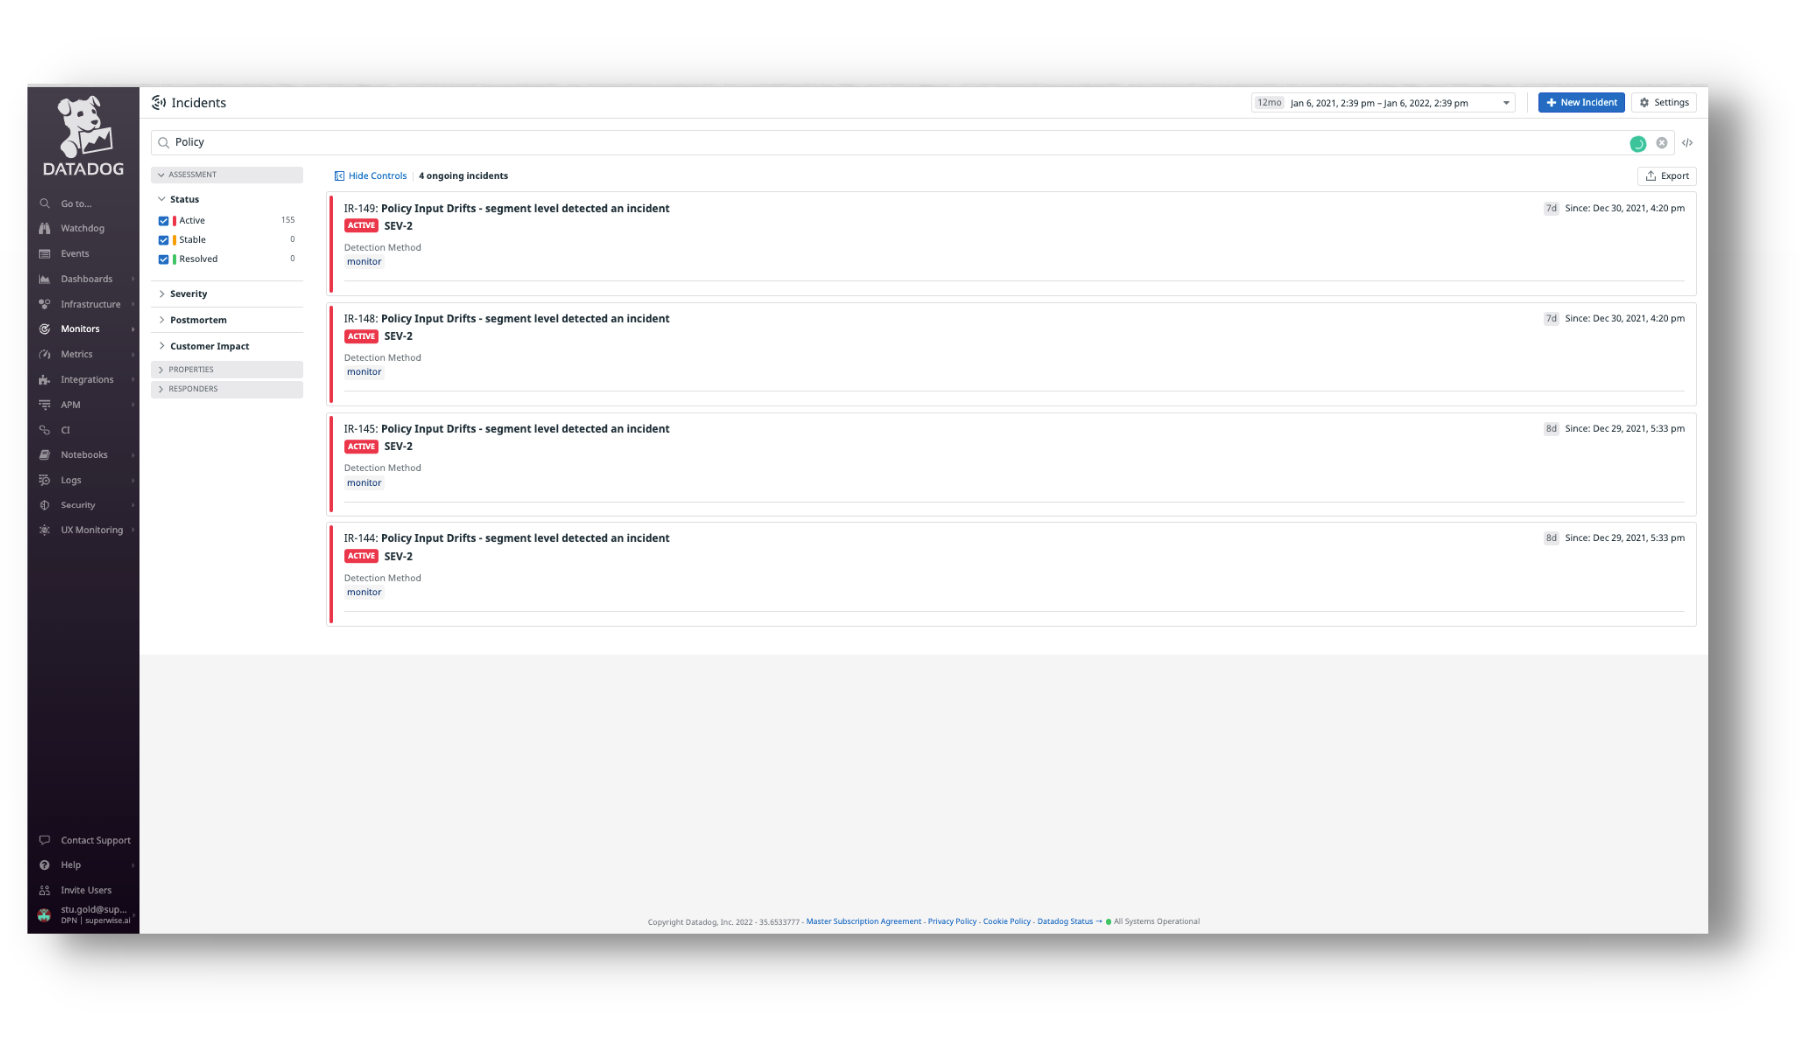
From now on, any new incident that was configured to be sent to Datadog will be available both in the Superwise model observability dashboard and as an integral part of the Datadog incident section:
> In Datadog's main-menu, go to Monitor > Incidents
Updated over 3 years ago
